Wisconsin 2012 Election Cost Data Overview
Wisconsin's 2012 election cost data provides insights into the expenses incurred during various statewide elections, including polling place costs, training, ballots, wages, and more. The breakdown of costs for different election components is detailed, showcasing the financial resources required to conduct elections in the state.

Download Presentation

Please find below an Image/Link to download the presentation.
The content on the website is provided AS IS for your information and personal use only. It may not be sold, licensed, or shared on other websites without obtaining consent from the author. Download presentation by click this link. If you encounter any issues during the download, it is possible that the publisher has removed the file from their server.
E N D
Presentation Transcript
Wisconsin Election Cost Data Voting in America Conference 2012 The Price of Elections Kevin J. Kennedy Director and General Counsel Wisconsin Government Accountability Board
Wisconsin Election Statistics 1,923 Jurisdictions 72 Counties 1,851 Municipalities 3,541 Reporting Units (2012 General Election) 6,676 Wards Approximately 30,000 Election Inspectors (Poll Workers) each election
2012 Wisconsin Statewide Elections April 3, 2012 Presidential Preference and Spring Election May 8, 2012 Recall Primary June 5, 2012 Recall Election August 14, 2012 Partisan Primary November 6, 2012 Presidential and General Election*(cost data not yet available)
Wisconsin Election Costs Year-To-Date Miscellaneous $1,430,881.49 5% Polling Place Documents $440,144.08 2% Training $1,267,658.01 5% Notices $1,053,494.22 4% Ballots $3,404,704.34 13% Polling Place Rental $117,590.07 0% Memory Devices $310,740.69 1% Programming $2,743,131.13 10% L.E.O. Staff $7,058,692.28 26% Ballot Bags $77,482.50 0% Wages - Poll Workers and Board of Canvassers $9,189,231.53 34%
Wisconsin Election Costs Year-To-Date Year-To-Date Election Costs $3,000,000.00 $2,500,000.00 $2,000,000.00 $1,500,000.00 $1,000,000.00 $500,000.00 $0.00 2012 Presidential Preference and Spring Election 2012 May 8 Recall Primary Election 2012 June 5 Recall Election 2012 Partisan Primary
Wisconsin Year-To-Date Election Costs 2012 Presidential Preference and Spring Election 2012 May 8 Recall Primary Election 2012 June 5 Recall Election 2012 Partisan Primary Election Year-To-Date Costs Total Cost $27,093,750.32 $7,678,647.48 $6,311,580.64 $7,230,397.94 $5,873,124.27 Training $1,267,658.01 $655,381.63 $161,250.35 $250,225.28 $200,800.75 Ballots $3,404,704.34 $956,166.27 $724,960.33 $983,857.58 $739,720.16 Memory Devices $310,740.69 $90,508.12 $117,798.05 $55,924.82 $46,509.70 Programming $2,743,131.13 $773,679.55 $616,890.90 $600,951.93 $751,608.75 Ballot Bags $77,482.50 $16,219.14 $11,618.49 $10,791.22 $38,853.65 Wages - Poll Workers and Board of Canvassers $9,189,231.53 $2,296,011.84 $2,292,419.91 $2,568,884.85 $2,031,914.93 L.E.O. Staff $7,058,692.28 $1,920,863.97 $1,768,462.01 $1,978,093.77 $1,391,272.53 Polling Place Rental $117,590.07 $31,753.17 $29,188.45 $27,297.45 $29,351.00 Notices $1,053,494.22 $320,576.25 $242,821.27 $252,030.07 $238,066.64 Polling Place Documents $440,144.08 $148,522.09 $101,366.65 $97,442.97 $92,812.37 Miscellaneous $1,430,881.49 $468,965.46 $244,804.24 $404,898.01 $312,213.79
2012 May 8 Recall Primary Election 2012 Presidential Preference and Spring Election Training 3% Polling Place Documents 2% Training 9% Polling Place Documents 2% Miscellaneous 4% Miscellaneous 6% Ballots 11% Notices 4% Ballots 13% Polling Place Rental 0% Memory Devices 2% Notices 4% Memory Devices 1% Polling Place Rental 0% Programming 10% Programming 10% Ballot Bags 0% Ballot Bags 0% Wages - Poll Workers and Board of Canvassers 36% Wages - Poll Workers and Board of Canvassers 30% L.E.O. Staff 28% L.E.O. Staff 25% 2012 June 5 Recall Election 2012 Partisan Primary Polling Place Documents 1% Training 3% Miscellaneous 5% Training 3% Polling Place Documents 1% Miscellaneous 6% Ballots 14% Notices 4% Ballots 13% Notices 4% Memory Devices 1% Memory Devices 1% Polling Place Rental 0% Polling Place Rental 0% Programming 8% Programming 13% Ballot Bags 0% Ballot Bags 1% Wages - Poll Workers and Board of Canvassers 35% Wages - Poll Workers and Board of Canvassers 36% L.E.O. Staff 24% L.E.O. Staff 27%
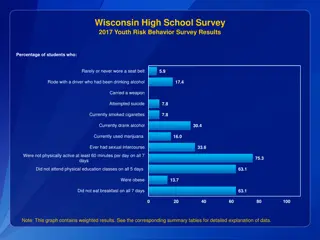
Wisconsin Voter Turnout General Elections Year and Election Voting Age Population (VAP) 4,378,741 4,378,741 4,372347 4,330,695 4,260,038 4,118,621 4,060,973 3,908,533 Votes Cast Percentage of VAP Voting 70.1% 57.4% 49.7% 69.2% 50.9% 72.9% 44.0% 67.0% 2012 General** 2012 Recall* 2010 General 2008 General 2006 General 2004 General 2002 General 2000 General 3,071,434 2,516,371 2,171,331 2,996,869 2,166,671 3,016,288 1,785,710 2,619,184 *2012 June 5 Recall Election included with General Elections ** 2012 Presidential and General Election Votes and Turnout based on official results for the office of President of the United States
Wisconsin Voter Turnout Partisan Primary Elections Year and Election Voting Age Population (VAP) 4,378,741 4,378,741 4,372,347 4,330,695 4,260,038 4,118,621 4,060,973 3,908,533 Votes Cast Percentage of VAP Voting 19.4% 31.0% 19.6% 8.9% 14.5% 16.7% 22.5% 10.4% 2012 Partisan Primary 2012 Recall Primary* 2010 Partisan Primary 2008 Partisan Primary 2006 Partisan Primary 2004 Partisan Primary 2002 Partisan Primary 2000 Partisan Primary 851,572 1,360,750 857,027 388,079 615,944 686,546 913,523 406,665 *2012 May 8 Recall Primary Election included with Partisan Primary Elections
Wisconsin Voter Turnout Presidential Preference Elections Year and Election Voting Age Population (VAP) Votes Cast Percentage of VAP Voting 26.1% 34.9% 24.1% 22.2% 2012 Presidential Preference 2008 Presidential Preference 2004 Presidential Preference 2000 Presidential Preference 4,378,741 4,330,695 4,118,621 3,908,533 1,144,351 1,511,639 992,242 866,965
Wisconsin Voter Turnout Spring Elections (w/o Pres. Pref.) Year and Election Voting Age Population (VAP) 2011 Spring Election 4,372,347 2010 Spring Election 4,372,347 2009 Spring Election 4,354,717 2008 Spring Election 4,294,976 2007 Spring Election 4,294,976 2006 Spring Election 4,260,038 2005 Spring Election 4,220,645 2004 2003 Spring Election 4,088,085 2002 2001 Spring Election 4,021,482 2000 Spring Election 3,908,533 Votes Cast Percentage of VAP Voting 34.8% 13.1% 18.2% 19.3% 19.3% 11.8% 17.1% 1,524,528 574,130 793,864 830,450 831,657 502,688 723,623 No Statewide Election 814,641 No Statewide Election 552,549 817,749 19.9% 13.7% 20.9%
Wisconsin Election Cost Data - Lessons Learned Difficult to collect data from 1,923 jurisdictions 72 Counties 190 Cities 406 Villages 1,255 Towns Approximately 62 percent of Municipal Clerks are Part-Time All 72 County Clerks are Elected
Wisconsin Election Cost Data - Lessons Learned Define cost categories in clear detail Without clear instructions, categories can be interpreted differently Provided clerks with three pages of instructions 2011 cost estimates versus 2012 cost data Total costs were similar, but major differences within categories Estimates did not separate poll worker wages from L.E.O. Staff costs for municipalities Categories for counties and municipalities were different
Wisconsin Election Cost Data - Lessons Learned Determining the frequency and timing of collection election cost data Fixed Costs Notices Polling place rental Variable Costs Ballots (including absentee costs) Programming electronic voting equipment Annually Purchasing voting equipment or memory devices Training L.E.O. Staff Each Election Poll worker wages Ballots
Wisconsin Election Cost Data - Lessons Learned Elections costs provide a valuable tool Policy change analysis Performance management Budgeting Identifying potential cost savings
Wisconsin Government Accountability Board Homepage: http://gab.wi.gov Statistics: http://gab.wi.gov/elections-voting/statistics Kevin J. Kennedy Director and General Counsel Kevin.Kennedy@wi.gov (608) 261-8683 Brian M. Bell, M.P.A. Election Data Manager Brian.Bell@wi.gov (608) 261-2011