Transitioning to High Renewable Electricity: Rethinking Market Design


R
e
t
h
i
n
k
i
n
g
E
l
e
c
t
r
i
c
i
t
y
M
a
r
k
e
t
D
e
s
i
g
n
:
t
r
a
n
s
i
t
i
o
n
i
n
g
t
o
h
i
g
h
r
e
n
e
w
a
b
l
e
e
l
e
c
t
r
i
c
i
t
y
David Newbery,
EPRG,
University of Cambridge
CEEPR & EPRG European Energy Policy Conference
Brussels
1
st
September 2022


D Newbery
2
2
0
2
2
B
a
c
k
g
r
o
u
n
d
•
B
r
i
t
i
s
h
E
n
e
r
g
y
S
e
c
u
r
i
t
y
S
t
r
a
t
e
g
y
s
e
t
s
t
a
r
g
e
t
s
:
b
y
2
0
3
0
e
x
p
e
c
t
–
5
0
G
W
o
f
f
-
s
h
o
r
e
w
i
n
d
(
1
1
G
W
n
o
w
)
=
>
m
o
r
e
t
h
a
n
o
n
e
1
0
M
W
t
u
r
b
i
n
e
e
v
e
r
y
d
a
y
–
4
0
G
W
s
o
l
a
r
P
V
(
1
3
G
W
n
o
w
)
–
2
5
-
3
0
G
W
o
n
-
s
h
o
r
e
w
i
n
d
(
1
3
G
W
n
o
w
)
•
f
u
l
l
y
d
e
c
a
r
b
o
n
i
s
e
d
e
l
e
c
t
r
i
c
i
t
y
b
y
2
0
3
5
–
n
o
o
n
s
h
o
r
e
w
i
n
d
i
n
E
&
W
“
b
u
t
w
i
l
l
c
o
n
s
u
l
t
.
.
o
n
d
e
v
e
l
o
p
i
n
g
l
o
c
a
l
p
a
r
t
n
e
r
s
h
i
p
s
f
o
r
…
c
o
m
m
u
n
i
t
i
e
s
w
h
o
w
i
s
h
t
o
h
o
s
t
n
e
w
o
n
s
h
o
r
e
w
i
n
d
”
•
Review of Electricity Market Arrangements
Consultation
–
“
d
o
n
o
t
c
o
n
s
i
d
e
r
t
h
a
t
e
x
i
s
t
i
n
g
m
a
r
k
e
t
a
r
r
a
n
g
e
m
e
n
t
s
a
r
e
l
i
k
e
l
y
t
o
d
e
l
i
v
e
r
o
u
r
a
m
b
i
t
i
o
n
f
o
r
a
d
e
c
a
r
b
o
n
i
s
e
d
a
n
d
s
e
c
u
r
e
e
l
e
c
t
r
i
c
i
t
y
s
y
s
t
e
m
b
y
2
0
3
5
a
t
l
e
a
s
t
p
o
s
s
i
b
l
e
c
o
s
t
t
o
c
o
n
s
u
m
e
r
s
”
•
National Grid ESO
–
H
o
l
i
s
t
i
c
n
e
t
w
o
r
k
d
e
s
i
g
n
(
i
n
t
e
g
r
a
t
e
d
p
l
a
n
n
i
n
g
f
o
r
o
f
f
-
s
h
o
r
e
w
i
n
d
)
L
i
t
t
l
e
c
h
a
n
c
e
o
f
r
e
a
c
h
i
n
g
t
a
r
g
e
t
s
w
i
t
h
o
u
t
m
a
j
o
r
c
h
a
n
g
e
U
K
r
e
n
e
w
a
b
l
e
e
l
e
c
t
r
i
c
i
t
y
c
a
p
a
c
i
t
y
t
o
t
r
e
b
l
e
b
y
2
0
3
0
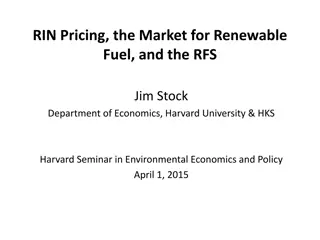
134
GW
46
GW
Source: FES 2022
J
u
l
y
2
0
2
2
r
e
n
e
w
a
b
l
e
s
a
u
c
t
i
o
n
Procurement
falling short of targets
M
e
s
s
a
g
e
s
•
Net zero requires
massive investment
•
Low-C is
capital intensive
–
t
h
e
k
e
y
t
o
l
o
w
e
r
i
n
g
c
o
s
t
i
s
l
o
w
e
r
i
n
g
c
o
s
t
o
f
c
a
p
i
t
a
l
b
y
r
e
d
u
c
i
n
g
r
i
s
k
–
l
e
n
g
t
h
y
p
e
r
i
o
d
s
o
f
l
o
w
p
r
i
c
e
s
=
>
c
o
n
t
r
a
c
t
s
c
o
v
e
r
c
o
s
t
•
Renewables – support needs reform
–
C
o
n
t
r
a
c
t
s
h
e
d
g
e
a
g
a
i
n
s
t
u
n
c
e
r
t
a
i
n
t
y
b
u
t
r
e
s
p
o
n
d
t
o
s
p
o
t
p
r
i
c
e
s
=
>
H
y
b
r
i
d
m
a
r
k
e
t
s
:
–
c
o
m
p
e
t
i
t
i
o
n
f
o
r
t
h
e
m
a
r
k
e
t
(
a
u
c
t
i
o
n
l
o
n
g
-
t
e
r
m
c
o
n
t
r
a
c
t
s
)
–
t
h
e
n
c
o
m
p
e
t
i
t
i
o
n
i
n
t
h
e
m
a
r
k
e
t
•
N
e
t
w
o
r
k
s
:
l
a
r
g
e
p
a
r
t
o
f
t
o
t
a
l
c
o
s
t
–
b
u
i
l
t
i
n
r
e
s
p
o
n
s
e
t
o
g
e
n
e
r
a
t
i
o
n
L
e
a
s
t
s
y
s
t
e
m
c
o
s
t
=
>
c
o
o
r
d
i
n
a
t
e
l
o
c
a
t
i
o
n
o
f
T
&
G
REMA
consultation July 2022
“market forces alone are currently unable to deliver our objectives”
=>
Change market design
and
network planning
for the Transition
–
Incremental or radical? Tried or novel?
avoid major revenue changes
resisted by incumbents
p
r
o
v
i
d
e
e
f
f
i
c
i
e
n
t
i
n
c
e
n
t
i
v
e
s
t
o
i
n
v
e
s
t
a
n
d
d
i
s
p
a
t
c
h
future proof for volatile prices and excess supply
–
What are the best options?
–
What can be changed immediately?
C
o
n
t
r
a
c
t
d
e
s
i
g
n
a
n
d
g
r
a
n
d
f
a
t
h
e
r
i
n
g
s
o
l
v
e
s
m
o
s
t
p
r
o
b
l
e
m
s
D Newbery
7
N
e
t
w
o
r
k
c
o
s
t
s
:
b
e
n
e
f
i
t
s
o
f
c
o
o
r
d
i
n
a
t
i
o
n
•
National Grid ESO
Holistic Network Design
for
offshore
wind:
–
O
p
t
i
m
i
s
e
d
c
o
s
t
t
o
d
e
l
i
v
e
r
5
0
G
W
o
f
f
s
h
o
r
e
w
i
n
d
=
£
5
4
b
n
–
Compares current responsive to
coordinated
approach
–
S
a
v
e
s
£
8
b
n
c
o
m
p
a
r
e
d
w
i
t
h
j
u
s
t
c
o
n
n
e
c
t
i
n
g
e
a
c
h
O
W
F
s
e
p
a
r
a
t
e
l
y
•
July 22 CfD auction price=
£37.35/MWh
for off-shore wind
–
Cost of off-shore =
£2.23 billion/GW
(BEIS 2020)
–
Cost of
HND
network to deliver off-shore =
£1.83 bn./GW
=
>
n
e
t
w
o
r
k
c
o
s
t
s
a
d
d
e
x
t
r
a
8
0
%
t
o
o
f
f
-
s
h
o
r
e
t
u
r
b
i
n
e
c
o
s
t
=
>
£
6
8
/
M
W
h
?
–
O
n
-
s
h
o
r
e
w
i
n
d
s
t
r
i
k
e
p
r
i
c
e
=
£
4
2
.
4
7
/
M
W
h
=
m
u
c
h
c
h
e
a
p
e
r
?
C
o
o
r
d
i
n
a
t
i
n
g
l
o
c
a
t
i
o
n
o
f
n
e
w
o
n
a
n
d
o
f
f
-
s
h
o
r
e
w
i
n
d
a
n
d
n
e
t
w
o
r
k
l
i
k
e
l
y
t
o
r
e
d
u
c
e
s
y
s
t
e
m
c
o
s
t
s
c
o
n
s
i
d
e
r
a
b
l
y
D Newbery
8
E
i
r
g
r
i
d
/
S
O
N
I
c
o
m
p
a
r
i
s
o
n
s
•
Eirgrid/SONI (2021)
Shaping our electricity future
for island of Ireland
•
Compares four approaches to planning networks
•
Developer-led is BAU as in GB –
63%
reflects higher curtailment
•
G
e
n
e
r
a
t
i
o
n
-
l
e
d
i
s
T
S
O
-
s
t
e
e
r
e
d
a
n
d
c
h
e
a
p
e
r
–
12.2 GW
vs
14.95 GW to meet 70% target (Offshore higher capacity cactor)
•
Technology-led: more HVDC and power electronics reduce curtailment
•
Demand-led assumes large load can be directed –
unlikely
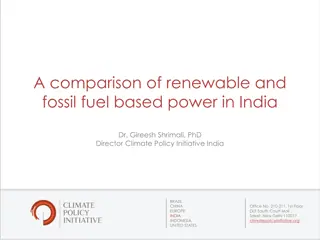
C
u
r
r
e
n
t
t
r
a
n
s
m
i
s
s
i
o
n
c
h
a
r
g
i
n
g
m
e
t
h
o
d
o
l
o
g
y
Problem:
local
hourly pattern of different
technologies not reflected in Annual Load
Factor (
ALF
)
Problem: charges
annually reset
,
discourages
substantial
necessary changes
Paid
if available
at peak
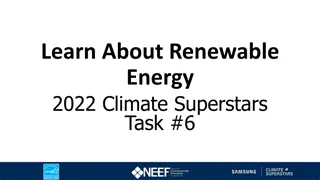
W
i
n
d
o
u
t
p
u
t
a
n
d
v
a
l
u
e
/
M
W
v
a
r
y
w
i
t
h
l
o
c
a
t
i
o
n
a
n
d
h
o
u
r
l
y
I
s
t
h
e
a
n
s
w
e
r
n
o
d
a
l
p
r
i
c
i
n
g
(
L
M
P
s
)
?
•
E
n
e
r
g
y
S
y
s
t
e
m
s
C
a
t
a
p
u
l
t
a
r
g
u
e
s
f
o
r
n
o
d
a
l
p
r
i
c
i
n
g
•
Ofgem: reviewing network charges since
1990
•
Project TransmiT
2008
•
Targeted Charging Review
2019
•
Response to distorting “embedded benefits”
•
Network Access and Forward-Looking Charges
•
reduce
connex charges, standardise non-firm access
•
TNUoS Call for Evidence - Next Steps
2022
•
N
G
E
S
O
N
e
t
w
o
r
k
O
p
t
i
o
n
s
A
s
s
e
s
s
m
e
n
t
:
r
i
s
i
n
g
c
o
n
s
t
r
a
i
n
t
c
o
s
t
s
Locational energy
pricing in the GB power
market
D Newbery
12
W
h
a
t
i
s
n
o
d
a
l
p
r
i
c
i
n
g
(
L
M
P
)
?
•
L
ocational
M
arginal
P
rice = cost to deliver 1 extra MW to a
node
= Energy cost + congestion cost + marginal loss
•
Proven
in US, NZ, Peru, Texas,… for decades
•
Payback in moving to LMP < 2 years in large systems
•
R
e
q
u
i
r
e
s
C
e
n
t
r
a
l
o
p
t
i
m
a
l
s
e
c
u
r
i
t
y
-
c
o
n
s
t
r
a
i
n
e
d
d
i
s
p
a
t
c
h
–
for a sufficient fraction to give reliable LMPs
–
Recomputed up to dispatch (at 5 min resolution)
–
P
J
M
i
n
t
r
o
d
u
c
e
d
o
v
e
r
w
e
e
k
e
n
d
.
H
a
r
d
e
r
p
a
r
t
i
s
s
e
t
t
i
n
g
u
p
c
e
n
t
r
a
l
d
i
s
p
a
t
c
h
•
R
e
m
o
v
e
s
n
e
e
d
f
o
r
r
e
d
i
s
p
a
t
c
h
a
n
d
b
a
l
a
n
c
i
n
g
•
B
u
t
r
e
q
u
i
r
e
s
s
u
i
t
a
b
l
e
h
e
d
g
e
s
D Newbery
13
F
l
a
w
e
d
a
r
g
u
m
e
n
t
s
a
g
a
i
n
s
t
L
M
P
1.
Market power
: inc-dec game => collapse of PJM=> LMP
=> Automated mitigation, long-lived complex offers reduce incentive to manipulate bids
2.
Barriers for unlocking
flexibility
local DSR encouraged by opting in to LMPs
3.
Market
liquidity
Churn > 3.6 for US RTO/ISO systems seems adequate
4.
Investment risk
N
e
e
d
g
o
o
d
h
e
d
g
i
n
g
i
n
s
t
r
u
m
e
n
t
s
–
r
e
q
u
i
r
e
d
a
n
y
w
a
y
t
o
r
e
d
u
c
e
c
o
s
t
s
5.
C
o
m
p
l
e
x
i
t
y
PJM clears 11,000 nodes, EUPHEMIA struggles with 40
Problem on linear pricing, rapid computational advances allow rapid solution
6.
Locational price differentiation
Already exists in GB with no obvious objection
Consumer default is zonal average LMPs (as at present)
Eicke & Schittekatte, 2022
D Newbery
14
G
u
i
d
i
n
g
l
o
c
a
t
i
o
n
d
e
c
i
s
i
o
n
s
:
t
w
o
a
p
p
r
o
a
c
h
e
s
•
Current GB system: set TNUoS each year; generation chooses location
–
TNUoS based on
zonal average
shadow LMPs
•
Minor change:
–
N
G
(
F
S
O
?
)
p
r
e
d
i
c
t
s
l
e
a
s
t
s
y
s
t
e
m
c
o
s
t
e
n
t
r
y
b
y
n
o
d
e
t
o
p
l
a
n
n
e
t
w
o
r
k
e
x
p
a
n
s
i
o
n
a
n
d
r
e
s
u
l
t
i
n
g
f
u
t
u
r
e
(
s
h
a
d
o
w
)
h
o
u
r
l
y
L
M
P
s
–
O
f
f
e
r
s
l
o
n
g
-
t
e
r
m
t
r
a
d
a
b
l
e
T
N
U
o
S
c
o
n
t
r
a
c
t
s
b
a
s
e
d
o
n
t
e
c
h
n
o
l
o
g
y
-
s
p
e
c
i
f
i
c
p
r
e
d
i
c
t
e
d
(
s
h
a
d
o
w
)
h
o
u
r
l
y
o
u
t
p
u
t
-
w
e
i
g
h
t
e
d
L
M
P
s
N
o
d
a
l
T
N
U
o
S
=
h
u
b
T
N
U
o
S
l
e
s
s
N
P
V
o
f
f
u
t
u
r
e
L
M
P
s
•
e
f
f
e
c
t
i
v
e
l
y
d
e
c
i
d
e
s
w
h
a
t
s
t
r
o
n
g
s
i
g
n
a
l
s
t
o
s
e
n
d
n
o
w
o
n
w
h
e
r
e
t
o
l
o
c
a
t
e
e
a
c
h
t
e
c
h
n
o
l
o
g
y
•
O
r
c
o
u
l
d
o
f
f
e
r
n
o
n
-
f
i
r
m
a
c
c
e
s
s
f
o
r
d
e
f
i
n
e
d
p
e
r
i
o
d
s
(
a
s
i
n
i
s
l
a
n
d
o
f
I
r
e
l
a
n
d
)
•
Radical changes
–
LMPs, ESO offers Financial Transmission Rights (FTRs) for incumbents
–
Create Independent Network Design Authority (INDA)
–
Secures consents
for best sites for entry and network expansion
–
Sites auctioned at optimal date
for connection and output contract
–
need long-term TNUoS contract as above for single renewables auction price
Newbery
15
R
e
f
o
r
m
i
n
g
V
R
E
s
u
p
p
o
r
t
•
Aim: minimise cost of
finance
while ensuring
market responsiveness
•
P
a
y
f
o
r
c
a
p
a
c
i
t
y
n
o
t
o
u
t
p
u
t
f
o
r
e
f
f
i
c
i
e
n
t
l
o
c
a
t
i
o
n
c
h
o
i
c
e
a
n
d
c
h
e
a
p
e
r
f
i
n
a
n
c
e
Costs are up-front, running costs independent of market prices
E
f
f
i
c
i
e
n
t
n
e
t
w
o
r
k
a
c
c
e
s
s
c
h
a
r
g
e
s
g
u
i
d
e
e
f
f
i
c
i
e
n
t
l
o
c
a
t
i
o
n
E
f
f
i
c
i
e
n
t
s
p
o
t
p
r
i
c
e
s
g
u
i
d
e
o
u
t
p
u
t
(
w
h
e
n
n
o
t
t
o
g
e
n
e
r
a
t
e
)
g
o
o
d
h
e
d
g
i
n
g
c
o
n
t
r
a
c
t
s
r
e
d
u
c
e
r
i
s
k
a
n
d
c
o
s
t
D
e
s
i
g
n
i
n
g
l
o
n
g
-
t
e
r
m
l
o
w
-
r
i
s
k
V
R
E
c
o
n
t
r
a
c
t
•
C
u
r
r
e
n
t
V
R
E
c
o
n
t
r
a
c
t
s
p
a
y
f
i
x
e
d
p
r
i
c
e
s
f
o
r
m
e
t
e
r
e
d
o
u
t
p
u
t
•
Standard CfD
independent of output
=
>
G
e
n
e
r
a
t
e
i
f
p
r
i
c
e
>
v
a
r
i
a
b
l
e
c
o
s
t
,
n
o
t
i
f
n
o
t
(
b
u
y
c
h
e
a
p
e
r
f
r
o
m
t
h
e
m
a
r
k
e
t
)
=
>
M
a
k
e
c
o
n
t
r
a
c
t
e
d
a
m
o
u
n
t
=
f
o
r
e
c
a
s
t
o
u
t
p
u
t
/
M
W
o
f
w
i
n
d
/
P
V
•
Limit number of
full operating hours
to remove location distortion
–
E.g. 40,000 MWh/MW
–
Self or mandated curtailment – still paid if
forecast potential output positive
•
A
u
c
t
i
o
n
t
o
d
e
t
e
r
m
i
n
e
s
t
r
i
k
e
p
r
i
c
e
s
f
o
r
n
e
w
c
o
n
t
r
a
c
t
s
D Newbery
16
R
e
f
o
r
m
s
e
q
u
e
n
c
i
n
g
I
m
m
e
d
i
a
t
e
(
l
o
w
h
a
n
g
i
n
g
f
r
u
i
t
)
:
•
Yardstick CfDs for RES at the
next auction round
–
need to be compatible with future LMPs
•
long-term TNUoS contracts for all
new
connections
–
with suitable charges for VRE based on forecast (shadow) LMPs
–
existing connections can be offered longer-term contracts or current system
•
allow
on-shore wind in England and Wales
– as already in Scotland, NI
L
o
n
g
e
r
t
e
r
m
:
•
I
n
t
r
o
d
u
c
e
L
M
P
s
a
n
d
c
e
n
t
r
a
l
d
i
s
p
a
t
c
h
•
FSO/INDA plans for least cost expansion of all technologies
–
charged to find acceptable sites for
on-shore wind
–
lower priced electricity to local area, districts compete over benefit share
–
auction sites with permits
D Newbery
17
C
o
n
c
l
u
s
i
o
n
s
:
m
a
r
k
e
t
d
e
s
i
g
n
•
Zero carbon electricity:
high capital cost, low variable cost
Long-term hedges to lower finance cost (
missing futures markets
)
–
Hedges: cover
independent of actual output
=> respond to market
=
>
C
f
D
w
i
t
h
F
i
T
f
o
r
V
R
E
n
e
e
d
s
c
h
a
n
g
e
–
c
a
p
a
c
i
t
y
n
o
t
o
u
t
p
u
t
s
u
p
p
o
r
t
t
o
h
e
d
g
e
u
p
-
f
r
o
n
t
c
o
s
t
s
f
o
r
l
o
w
W
A
C
C
–
better
location
and dispatch signals guided by
market, not support,
prices
–
h
e
d
g
e
s
e
t
n
o
t
b
y
m
e
t
e
r
e
d
o
u
t
p
u
t
b
u
t
f
o
r
e
c
a
s
t
o
u
t
p
u
t
(
y
a
r
d
s
t
i
c
k
p
r
i
c
i
n
g
)
–
c
o
n
t
r
a
c
t
s
p
e
c
i
f
i
e
d
f
o
r
f
u
l
l
o
p
e
r
a
t
i
n
g
h
o
u
r
s
,
n
o
t
y
e
a
r
s
•
L
o
n
g
-
t
e
r
m
T
N
U
o
S
c
o
n
t
r
a
c
t
s
o
n
f
o
r
e
c
a
s
t
L
M
P
s
–
F
T
R
s
p
l
u
s
g
r
a
n
d
f
a
t
h
e
r
i
n
g
f
o
r
s
m
o
o
t
h
t
r
a
n
s
i
t
i
o
n
a
n
d
h
e
d
g
i
n
g
•
Move to LMP or equivalent and voluntary central dispatch
C
o
o
r
d
i
n
a
t
e
g
e
n
e
r
a
t
i
o
n
a
n
d
t
r
a
n
s
m
i
s
s
i
o
n
l
o
c
a
t
i
o
n
/
t
i
m
i
n
g
R
e
f
e
r
e
n
c
e
s
a
n
d
s
p
a
r
e
s
l
i
d
e
s
David Newbery,
EPRG,
University of Cambridge
CEEPR & EPRG European Energy Policy Conference
Brussels
1
st
September 2022
D Newbery
19
R
e
f
e
r
e
n
c
e
s
•
BEIS, 2020
. Generation Cost Report,
at
https://www.gov.uk/government/publications/beis-
electricity-generation-costs-2020
•
BEIS Review of Electricity Market Arrangements: Consultation Document
at
https://www.gov.uk/government/consultations/review-of-electricity-market-arrangements
•
Eicke, A. & T Schittekatte, 2022. Fighting the wrong battle? A critical assessment of arguments
against nodal electricity prices in the European debate, MITEI-WP-2022-01
•
Newbery, D., 2021. National Energy and Climate Plans for the island of Ireland: wind
curtailment, interconnectors and storage,
Energy Policy
158, 112513, 1-11.
https://doi.org/10.1016/j.enpol.2021.112513
also EPRG WP2020 at
https://www.eprg.group.cam.ac.uk/eprg-working-paper-2020/
.
•
Newbery, D., 2021. Designing efficient Renewable Electricity Support Schemes, at
https://www.eprg.group.cam.ac.uk/eprg-working-paper-2107/
•
Newbery, D., 2020. Club goods and a tragedy of the commons: the
Clean Energy Package
and
wind curtailment, at
https://www.eprg.group.cam.ac.uk/eprg-working-paper-2036/
A
c
r
o
n
y
m
s
CfD:
Contract for Difference
CRM
Capacity Remuneration Mechanism
ESO
Electricity System Operator (separated from Nat Grid, thus NGESO)
FiT:
Feed-in Tariff
FSO
Future System Operator – publicly owned evolution fromESO
FTR
Financial Transmission Right
INDA
Independent Network Design Authority
LMP
Locational Marginal Price
LT
Long term
OWF
Off-shore wind farm
PJM
Pennsylvania-New Jersey-Maryland interconnection (now wider)
REMA:
Review of electricity market arrangements
RTO
Regional Transmission Operator (as in US)
SEM:
Single electricity market of the island of Ireland
TNUoS
Transmission Network Use of System
VRE:
variable renewable electricity
WACC:
weighted average cost of capital
20
D Newbery
21
E
f
f
i
c
i
e
n
t
t
r
a
n
s
m
i
s
s
i
o
n
i
n
v
e
s
t
m
e
n
t
n
o
t
f
i
n
a
n
c
e
a
b
l
e
b
y
L
M
P
s
•
P
e
r
s
i
s
t
e
n
t
n
o
d
a
l
p
r
i
c
e
d
i
f
f
e
r
e
n
c
e
s
i
n
d
i
c
a
t
e
v
a
l
u
e
o
f
g
r
i
d
r
e
i
n
f
o
r
c
e
m
e
n
t
•
C
o
n
g
e
s
t
i
o
n
r
e
v
e
n
u
e
d
o
e
s
n
o
t
c
o
v
e
r
o
p
t
i
m
a
l
e
x
p
a
n
s
i
o
n
–
e
c
o
n
o
m
i
e
s
o
f
s
c
a
l
e
/
n
e
t
w
o
r
k
e
f
f
e
c
t
s
•
B
r
a
e
s
s
p
a
r
a
d
o
x
–
a
d
d
i
n
g
a
p
p
a
r
e
n
t
l
y
p
r
o
f
i
t
a
b
l
e
l
i
n
k
c
a
n
i
n
c
r
e
a
s
e
t
o
t
a
l
c
o
n
g
e
s
t
i
o
n
n
e
e
d
s
y
s
t
e
m
d
e
s
i
g
n
e
r
https://phys.org/news/2012-10-power-grid-blackouts-
braess-paradox.html
O
f
f
-
s
h
o
r
e
“
p
i
p
e
l
i
n
e
”
c
l
a
i
m
e
d
a
t
8
6
G
W
excluding plant operating, actual pipeline is 68 GW, of which 56 GW are in
planning, under development or yet to secure a lease
D Newbery
23
S
i
l
l
y
i
d
e
a
s
•
BEIS “we are exploring reforms that move away from marginal pricing.
These options are novel, and in some instances
only theoretical
” (see
objections on BEIS p67
)
•
UCL/OUIES has been pushing “Two-market” solution
–
for “on-demand” or “as available” (VRE) power
–
consumers buy each separately (two meters)
•
Supposed to be consumer-led and drive innovation (!)
–
But: high transaction costs,
–
loses economies of integration
–
Raises WACC, unlikely to deliver required investment
•
B
E
I
S
:
“
s
p
l
i
t
t
i
n
g
t
h
e
m
a
r
k
e
t
c
o
u
l
d
p
o
t
e
n
t
i
a
l
l
y
e
n
a
b
l
e
a
l
l
t
y
p
e
s
o
f
i
n
v
e
s
t
o
r
s
t
o
r
e
c
o
u
p
t
h
e
i
r
c
o
s
t
s
t
h
r
o
u
g
h
m
a
r
k
e
t
r
e
v
e
n
u
e
s
a
l
o
n
e
(
t
h
o
u
g
h
a
m
e
c
h
a
n
i
s
m
t
o
e
n
s
u
r
e
s
e
c
u
r
i
t
y
o
f
s
u
p
p
l
y
i
s
l
i
k
e
l
y
t
o
c
o
n
t
i
n
u
e
t
o
b
e
n
e
e
d
e
d
i
n
d
e
f
i
n
i
t
e
l
y
)
(
?
!
!
)
–
G
o
o
d
c
o
n
t
r
a
c
t
d
e
s
i
g
n
c
a
n
p
r
o
v
i
d
e
t
h
e
s
e
c
l
a
i
m
e
d
b
e
n
e
f
i
t
s
a
t
l
o
w
e
r
c
o
s
t
The presentation by David Newbery, EPRG, University of Cambridge, discusses the transition to high renewable electricity. It covers targets set by the British Energy Security Strategy, challenges in current market arrangements, the need for major changes, and strategies to achieve decarbonized and secure electricity systems by 2035. The discussion emphasizes the importance of market reform and efficient incentives for investment in renewable energy.

Download Presentation

Please find below an Image/Link to download the presentation.
The content on the website is provided AS IS for your information and personal use only. It may not be sold, licensed, or shared on other websites without obtaining consent from the author. Download presentation by click this link. If you encounter any issues during the download, it is possible that the publisher has removed the file from their server.
E N D
Presentation Transcript
Rethinking Electricity Market Design: transitioning to high renewable electricity David Newbery, EPRG, University of Cambridge CEEPR & EPRG European Energy Policy Conference Brussels 1stSeptember 2022 www.eprg.group.cam.ac.uk
2022 Background British Energy Security Strategy sets targets: by 2030 expect 50 GW off-shore wind (11 GW now) => more than one 10MW turbine every day 40 GW solar PV (13 GW now) 25-30 GW on-shore wind (13 GW now) fully decarbonised electricity by 2035 no onshore windin E&W but will consult.. on developing local partnerships for communities who wish to host new onshore wind Review of Electricity Market Arrangements Consultation do not consider that existing market arrangements are likely to deliver our ambition for a decarbonised and secure electricity system by 2035 at least possible cost to consumers National Grid ESO Holistic network design (integrated planning for off-shore wind) Little chance of reaching targets without major change D Newbery 2 www.eprg.group.cam.ac.uk
UK renewable electricity capacity to treble by 2030 134 GW 46 GW Source: FES 2022 www.eprg.group.cam.ac.uk
July 2022 renewables auction Procurement falling short of targets www.eprg.group.cam.ac.uk
Messages Net zero requires massive investment Low-C is capital intensive the key to lowering cost is lowering cost of capital by reducing risk lengthy periods of low prices => contracts cover cost Renewables support needs reform Contracts hedge against uncertainty but respond to spot prices => Hybrid markets: competition for the market (auction long-term contracts) then competition in the market Networks: large part of total cost built in response to generation Least system cost => coordinate location of T&G www.eprg.group.cam.ac.uk
REMA consultation July 2022 market forces alone are currently unable to deliver our objectives => Change market design and network planning for the Transition Incremental or radical? Tried or novel? avoid major revenue changes resisted by incumbents provide efficient incentives to invest and dispatch future proof for volatile prices and excess supply What are the best options? What can be changed immediately? Contract design and grandfathering solves most problems www.eprg.group.cam.ac.uk
Network costs: benefits of coordination National Grid ESO Holistic Network Design for offshore wind: Optimised cost to deliver 50 GW offshore wind = 54 bn Compares current responsive to coordinated approach Saves 8bn compared with just connecting each OWF separately July 22 CfD auction price= 37.35/MWh for off-shore wind Cost of off-shore = 2.23 billion/GW (BEIS 2020) Cost of HND network to deliver off-shore = 1.83 bn./GW => network costs add extra 80% to off-shore turbine cost => 68/MWh? On-shore wind strike price = 42.47/MWh = much cheaper? Coordinating location of new on and off-shore wind and network likely to reduce system costs considerably 7 D Newbery www.eprg.group.cam.ac.uk
Eirgrid/SONI comparisons Eirgrid/SONI (2021) Shaping our electricity future for island of Ireland Compares four approaches to planning networks On-shore wind GW 5.8 10.2 10.2 10.2 off-shore wind GW PV GW 5.2 2.15 2.15 2.15 network cost millions 853 2,308 2,144 670 RE costs millions 20,314 20,409 20,409 20,409 RE in 2030 70% 63% 70% 70% Approach Generation-led Developer-led Technology-led Demand-led total 1.2 2.6 2.6 2.6 21,167 22,717 22,553 21,079 Developer-led is BAU as in GB 63% reflects higher curtailment Generation-led is TSO-steered and cheaper 12.2 GW vs 14.95 GW to meet 70% target (Offshore higher capacity cactor) Technology-led: more HVDC and power electronics reduce curtailment Demand-led assumes large load can be directed unlikely D Newbery 8 www.eprg.group.cam.ac.uk
Current transmission charging methodology Problem: local hourly pattern of different technologies not reflected in Annual Load Factor (ALF) Problem: charges annually reset, discourages substantial necessary changes Paid if available at peak www.eprg.group.cam.ac.uk
Wind output and value/MW vary with location and hourly www.eprg.group.cam.ac.uk
Is the answer nodal pricing (LMPs)? Energy Systems Catapult argues for nodal pricing Ofgem: reviewing network charges since 1990 Project TransmiT 2008 Targeted Charging Review 2019 Response to distorting embedded benefits Network Access and Forward-Looking Charges reduce connex charges, standardise non-firm access TNUoS Call for Evidence - Next Steps 2022 Locational energy pricing in the GB power market NGESONetwork Options Assessment: rising constraint costs www.eprg.group.cam.ac.uk
What is nodal pricing (LMP)? Locational Marginal Price = cost to deliver 1 extra MW to a node = Energy cost + congestion cost + marginal loss Proven in US, NZ, Peru, Texas, for decades Payback in moving to LMP < 2 years in large systems Requires Central optimal security-constrained dispatch for a sufficient fraction to give reliable LMPs Recomputed up to dispatch (at 5 min resolution) PJM introduced over weekend. Harder part is setting up central dispatch Removes need for redispatch and balancing But requires suitable hedges D Newbery 12 www.eprg.group.cam.ac.uk
Flawed arguments against LMP 1. Market power: inc-dec game => collapse of PJM=> LMP => Automated mitigation, long-lived complex offers reduce incentive to manipulate bids 2. Barriers for unlocking flexibility local DSR encouraged by opting in to LMPs 3. Market liquidity Churn > 3.6 for US RTO/ISO systems seems adequate 4. Investment risk Need good hedging instruments required anyway to reduce costs 5. Complexity PJM clears 11,000 nodes, EUPHEMIA struggles with 40 Problem on linear pricing, rapid computational advances allow rapid solution 6. Locational price differentiation Already exists in GB with no obvious objection Consumer default is zonal average LMPs (as at present) Eicke & Schittekatte, 2022 D Newbery 13 www.eprg.group.cam.ac.uk
Guiding location decisions: two approaches Current GB system: set TNUoS each year; generation chooses location TNUoS based on zonal average shadow LMPs Minor change: NG (FSO?) predicts least system cost entryby node to plan network expansion and resulting future (shadow) hourly LMPs Offers long-term tradable TNUoS contracts based on technology-specific predicted (shadow) hourly output-weighted LMPs Nodal TNUoS = hub TNUoS lessNPV of future LMPs effectively decides what strong signals to send now on where to locate each technology Or could offer non-firm access for defined periods (as in island of Ireland) Radical changes LMPs, ESO offers Financial Transmission Rights (FTRs) for incumbents Create Independent Network Design Authority (INDA) Secures consents for best sites for entry and network expansion Sites auctioned at optimal date for connection and output contract need long-term TNUoS contract as above for single renewables auction price D Newbery 14 www.eprg.group.cam.ac.uk
Reforming VRE support Aim: minimise cost of finance while ensuring market responsiveness Pay for capacity not output for efficient location choice and cheaper finance Costs are up-front, running costs independent of market prices Efficient network access charges guide efficient location Efficient spot prices guide output (when not to generate) good hedging contracts reduce risk and cost Designing long-term low-risk VRE contract Current VRE contracts pay fixed price s for metered output Standard CfD independent of output => Generate if price>variable cost, not if not (buy cheaper from the market) => Make contracted amount = forecast output/MW of wind/PV Limit number of full operating hours to remove location distortion E.g. 40,000 MWh/MW Self or mandated curtailment still paid if forecast potential output positive Auction to determine strike price s for new contracts Newbery 15 www.eprg.group.cam.ac.uk
Reform sequencing Immediate (low hanging fruit): Yardstick CfDs for RES at the next auction round need to be compatible with future LMPs long-term TNUoS contracts for all new connections with suitable charges for VRE based on forecast (shadow) LMPs existing connections can be offered longer-term contracts or current system allow on-shore wind in England and Wales as already in Scotland, NI Longer term: Introduce LMPs and central dispatch FSO/INDA plans for least cost expansion of all technologies charged to find acceptable sites for on-shore wind lower priced electricity to local area, districts compete over benefit share auction sites with permits D Newbery 16 www.eprg.group.cam.ac.uk
Conclusions: market design Zero carbon electricity: high capital cost, low variable cost Long-term hedges to lower finance cost (missing futures markets) Hedges: cover independent of actual output => respond to market => CfD with FiT for VRE needs change capacity not output support to hedge up-front costs for low WACC better location and dispatch signals guided by market, not support, prices hedge set not by metered output but forecast output (yardstick pricing) contract specified for full operating hours, not years Long-term TNUoS contracts on forecast LMPs FTRs plus grandfathering for smooth transition and hedging Move to LMP or equivalent and voluntary central dispatch Coordinate generation and transmission location/timing 17 D Newbery www.eprg.group.cam.ac.uk
References and spare slides David Newbery, EPRG, University of Cambridge CEEPR & EPRG European Energy Policy Conference Brussels 1st September 2022 www.eprg.group.cam.ac.uk
References BEIS, 2020. Generation Cost Report, at https://www.gov.uk/government/publications/beis- electricity-generation-costs-2020 BEIS Review of Electricity Market Arrangements: Consultation Document at https://www.gov.uk/government/consultations/review-of-electricity-market-arrangements Eicke, A. & T Schittekatte, 2022. Fighting the wrong battle? A critical assessment of arguments against nodal electricity prices in the European debate, MITEI-WP-2022-01 Newbery, D., 2021. National Energy and Climate Plans for the island of Ireland: wind curtailment, interconnectors and storage, Energy Policy 158, 112513, 1-11. https://doi.org/10.1016/j.enpol.2021.112513 also EPRG WP2020 at https://www.eprg.group.cam.ac.uk/eprg-working-paper-2020/. Newbery, D., 2021. Designing efficient Renewable Electricity Support Schemes, at https://www.eprg.group.cam.ac.uk/eprg-working-paper-2107/ Newbery, D., 2020. Club goods and a tragedy of the commons: the Clean Energy Package and wind curtailment, at https://www.eprg.group.cam.ac.uk/eprg-working-paper-2036/ D Newbery 19 www.eprg.group.cam.ac.uk
Acronyms CfD: CRM ESO FiT: FSO FTR INDA LMP LT OWF PJM REMA: RTO SEM: TNUoS VRE: WACC: Contract for Difference Capacity Remuneration Mechanism Electricity System Operator (separated from Nat Grid, thus NGESO) Feed-in Tariff Future System Operator publicly owned evolution fromESO Financial Transmission Right Independent Network Design Authority Locational Marginal Price Long term Off-shore wind farm Pennsylvania-New Jersey-Maryland interconnection (now wider) Review of electricity market arrangements Regional Transmission Operator (as in US) Single electricity market of the island of Ireland Transmission Network Use of System variable renewable electricity weighted average cost of capital 20 www.eprg.group.cam.ac.uk
Efficient transmission investment not financeable by LMPs Persistent nodal price differences indicate value of grid reinforcement Congestion revenue does not cover optimal expansion economies of scale/network effects Braess paradox adding apparently profitable link can increase total congestion need system designer https://phys.org/news/2012-10-power-grid-blackouts- braess-paradox.html D Newbery 21 www.eprg.group.cam.ac.uk
Off-shore pipeline claimed at 86 GW excluding plant operating, actual pipeline is 68 GW, of which 56 GW are in planning, under development or yet to secure a lease www.eprg.group.cam.ac.uk
Silly ideas BEIS we are exploring reforms that move away from marginal pricing. These options are novel, and in some instances only theoretical (see objections on BEIS p67) UCL/OUIES has been pushing Two-market solution for on-demand or as available (VRE) power consumers buy each separately (two meters) Supposed to be consumer-led and drive innovation (!) But: high transaction costs, loses economies of integration Raises WACC, unlikely to deliver required investment BEIS: splitting the market could potentially enable all types of investors to recoup their costs through market revenues alone (though a mechanism to ensure security of supply is likely to continue to be needed indefinitely) (?!!) Good contract design can provide these claimed benefits at lower cost D Newbery 23 www.eprg.group.cam.ac.uk


?")
?")