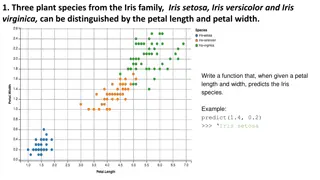
Environmental Impact of Introduced Species in Australia

Early European settlers introduced various animals to Australia, leading to severe environmental consequences such as competition with native species, soil erosion, and changes in plant communities. The rabbit and fox are identified as major culprits causing significant harm to the ecosystem.

Download Presentation

Please find below an Image/Link to download the presentation.
The content on the website is provided AS IS for your information and personal use only. It may not be sold, licensed, or shared on other websites without obtaining consent from the author. Download presentation by click this link. If you encounter any issues during the download, it is possible that the publisher has removed the file from their server.
E N D
Presentation Transcript
Year 8 Geog Readings For Starter Sheets
Year 8 Geog Skills No. 1 Grid References Use the map A to answer the following. (1) Who lives in the small houses in B2 and C2?_________________ (2) How far would the church congregation have to travel after a service to enjoy a barbecue in Royal Park?____________________ (3) Which railway line would have been the more expensive to build, the the western line or the northern line? Give reasons for your answer______________________________________________ ___________________________________________________ (4) In which general direction does the River Tir flow? __________ (5) At which Area Reference do three roads meet up? ____________________________________________________ (6) What would be a good fishing spot in C5? __________________ (7) Which road does the council have plans to improve? ____________________________________________________ (8) What is the Grid Reference of a kiosk in the south west corner of Royal Park?_________________________________________ (9) Is it true or false that the church is north of one railway line and west of the other?_____________________________________ (10) Identify three natural physical features shown on the map. ____________________________________________________ ____________________________________________________ Use the map B to answer the following questions (1) If you travel from the church to the lake, in what direction would you travel? __________________________________________ (2) Why are there no houses in the south west?________________ ___________________________________________________ (3) What is the highest point in the area?_____________________ (4) Why do most residents live in the eastern region? ____________ ____________________________________________________ (5) What facility that would help tourists is to the west of the town? ____________________________________________________ (6)What features may attract tourists to this area? ____________________________________________________ ___________________________________________________ A B C D E F
Year 8 Geog Skills No. 2 Grid References Plot and join the following points:- 1. 131 393 join to 209 469 2. 131 469 join to 209 393 3. 108 430 to 153 447 to 4. 170 494 to 187 447 to 5. 234 430 to 187 414 to 6. 170 367 to 153 414 and back to 108 430. 7. 139 441 to 131 469 to 158 461 8. 181 461 to 209 469 to 201 441 9. 201 419 to 209 393 to 182 401 10. 159 399 to 131 393 to 139 419 11. Now Label the compass you have made. Remember Never Entertain Sexy Women 12. 13. 14. 15.
Year 8 Geog Skills No.3a Introduced Species Our early settlers introduced many European and domestic animals to Australia. These have caused great environmental damage. Some compete with and kill native animals and cause soil erosion and changes in plant communities. The two main villains are the rabbit and the fox. Attempts to control the rabbit plague with myxomatosis were successful at first but the rabbits developed resistance. Foxes are believed responsible for the extinction of 11 small native mammals already. They have also pushed several endangered species to the brink of extinction. Scientists from CSIRO are working on a virus to prevent foxes from reproducing.
a tropical rainforests of North Queensland _____________________________________ a sport or hunting? _______________________________________________________ b central Australian deserts ________________________________________________ 6 Name some other introduced animals not mentioned in the table.____________________ c Which animals are shot from helicopters?_____________________________________ b Why is control of these animals described as 'attempted'?________________________ 2 a What is the most common method of attempted control?________________________ 8 Which is the only Australian State that does not have the red fox.' Why? ____________ b From an environmental point of view, why is it important to desex pet cats? ___________ d sheep wheat farmlands __________________________________________________ their former habitat. Suggest ways that rangers can prevent these fragile populations from b food? _______________________________________________________________ 5. Choose any two animals (except rabbits and foxes) and explain why they are dangerous to e urban _______________________________________________________________ c Kakadu wetlands _______________________________________________________ change the natural environment. Explain what this means. __________________________ _____________________________________________________________________ _____________________________________________________________________ the environment. ________________________________________________________ _____________________________________________________________________ _____________________________________________________________________ _____________________________________________________________________ _____________________________________________________________________ _____________________________________________________________________ _____________________________________________________________________ _____________________________________________________________________ _____________________________________________________________________ _____________________________________________________________________ 9 aWhy are some councils considering curfews on domestic cats? ____________________ c transport? ___________________________________________________________ being destroyed by feral animals. ___________________________________________ 10 Several endangered mammal species are being bred in captivity and reintroduced into g Rabbits today are successfully controlled by myxomatosis. _____________________ 7 It has been said that foxes cause the extinction of native animals species but rabbits b Camels are restricted to the arid centre of Australia. _____________________ j Feral cats are found only around human settlements. _____________________ h Foxes have caused 11 small mammal extinctions. _____________________ e Angora goats were introduced for their mohair. _____________________ d The red fox is not found in Western Australia. _____________________ 3 Which feral animals are likely to be found in the following environments, i Buffalo are shot for their meat and skins. _____________________ c Feral pigs can have up to 12 young a year. _____________________ a Rabbits are found all over Australia. _____________________ f Donkeys were not feral until 1866. _____________________ 4 Mark true or false (T or F) for each of these statements: 1 Which animals were introduced into Australia for: Year 8 Geog Skills No.3b
2 Many plants and animals are unique to Australia. a Using the diagram name the categories and the percentage of species that are unique to Australia. ______________________________________________ ______________________________________________ _____________________________________________ b Give some reasons why this percentage is so high for most plants and animals. _______________________________ ______________________________________________ ______________________________________________ c Where else in the world would you find the same species as those in Australia? _____________________________ ______________________________________________ d Why are 30 per cent of Australian birds found elsewhere in the world? (Hint: Some birds escape winter.) __________ ______________________________________________ 3 Rank Australia's biodiversity from highest to lowest according to the number of species in each category. ______________________________________________ ______________________________________________ ______________________________________________ ______________________________________________ Extension Questions 1 Some species are extinct over most of Australia but still live in small, isolated areas called `refuges'. Why do these refuge areas need conserving?_______________________ ______________________________________________ ______________________________________________ 2 Describe some land use activities that have caused habitat loss. __________________________________ ______________________________________________ ______________________________________________ ______________________________________________ ______________________________________________ ______________________________________________ _____________________________________________ Year 8 Geog Skills No. 4 Biodiversity Graph Skills Biological diversity' is the term used for the variety of life on earth. It includes all species of plants, animals and micro organisms as well as the ecosystems they create. Australia's biodiversity is significant in two ways: (1) its contribution to global (worldwide) biodiversity; and (2) the high percentage of living things which are unique to Australia 1 a Which organisms are the most numerous in Australia? ___________________________________________ b Why don't scientists know the exact species numbers of these organisms? _______________________________
5. Many people (visited) _________________ 7. Many explorers (made) ________________ 1. Scientists (conducted) ________________ ____________________________ ___ many according (became) _____________________________ winter, so they (got) ___________________ 4. Scientists working in Antarctica are cut off __________________________extensive ____________________________________ Change the verbs from past tense to is/are/am a harmonious relationship with the environment. __________________________ from South _________________________Antarctica to _________________ ancient stories to their ___________________________the trip to 2. Documentaries and movies about Antarctica people (made) _______________________ their homes out of blocks of ice in the tundra. 12. Many individuals who want to experience a 6. Some (left) ______________________ 10. Inuit mothers (told) ______________ ______________________________ the 9. Even today, the Inuit which means the from Tasmania, while others (embarked) children to keep the Inuit tradition alive. 8. In the Arctic the Inuit people (live) 3. The Australian government (placed) pristine, natural environment (visited) fascinating polar regions of the world. research personnel in their facility in _________________________ 11. The Inuit people (maintained) from the rest of the world during research on Antarctica. to their traditional ways. Antarctica by helicopter. see its unique landscape Year 8 Geog Skills 5 used to the isolation. ___________ ing. Text Types skills Antarctica. America. popular. vulnerable?_______________________ suffered extinction? _______________ _______________________________ _______________________________ _______________________________ _______________________________ _______________________________ _______________________________ _______________________________ _______________________________ _______________________________ _______________________________ vulnerable? ______________________ animals? ________________________ endangered?_____________________ than that listed? (Hint: Look at the key.) numbers of extinct animals to be higher b How many mammals are regarded as b Which categories have endangered 2 a How many animals are classified as _____________________________ b Which categories of animals have 1 a How many Australian animals have 3 a Which type of animal is the most Europeans, just over 200 years ago? become extinct since the arrival of 4 Why would it be possible for the
Year 8 Geog Skills No. 6a Land Degradation The clearing of the native vegetation for crops and timber has resulted in land degradation. This is one of the most serious environmental problems in Australia. When land is cleared of vegetation there is a rise in the ground water level (the water table). This may then lead to salinity (saltiness), either dry land salinity or irrigated land salinity. When the soil is exposed it can be removed by wind and water. This is called erosion. The decaying, organic protective layer of top soil is called humus. When this is reduced, soil structure is changed and fertility declines. Use of pesticides and chemical fertilizers can lead to land and water pollution, algal blooms and soil acidity. Vegetation degradation also occurs with clearing and overgrazing by animals. Disturbed areas are often invaded by weeds and introduced plants. The graph in this unit shows the extent of degraded agricultural land in Australia by State. About 70 per cent of Australia is arid and only 30 per cent is farmed. The graph shows the degradation of the 30 per cent of agricultural land, not of the State as a whole. Graph Skills 1 a Which State has the most land requiring treatment? ______________________________________________ b Give some reasons. (Hint: The length of time of settlement and the climate will give you a clue.) ___________________ ______________________________________________ 2 a Which State has the least amount of degraded agricultural land? _____________________________ b Give some reasons for this. _______________________ ___________________________________________ 3 a Estimate the % of land requiring treatment in: i Northern Territory; _____________________________ ii South Australia.________________________________ b Estimate the % of land requiring no treatment in : i Victoria; _______________________________ ii Western Australia._______________________ 4 Rank the States and Territories from highest to lowest according to the percentage of land requiring treatment. ______________________________________________ ______________________________________________ ______________________________________________ ______________________________________________ ______________________________________________ 5Using a calculator, calculate the percentage of agricultural land requiring treatment for the whole of Australia (the totals of each of the eight States and Territories = 8). ______________________________________________ 6What percentage of land required treatment as a result of water erosion in: a New South Wales?______________________________ b Australian Capital Territory?______________________ 7 a Which State had the highest percentage of land with vegetation degradation? ___________________________ b Give the percentage of land with vegetation degradation for that State. __________________________________ 8What percentage of land requires treatment for the following: a wind erosion in South Australia _____________________ b salinity in Victoria ______________________________ 9Which States are affected by: a wind erosion?__________________________________ b wind and water erosion?__________________________ c salinity?______________________________________ 10 a Which type of degradation has the highest percentage of land requiring treatment for all the States? ______________________________________________ b Why would this type be more obvious to an observer than salinity? ___________________________________ ______________________________________________ ______________________________________________ ______________________________________________
Year 8 Geog Skills No. 6b Extension Questions 1. Classify the degradation problems of each state under the following headings: i. Minimal, ii Moderate, iii Serious 2. Draw 8 circles and construct pie graphs one for each state and territory showing the percentage of land requiring treatment
Year 8 Geog Skills No. 6 Tourist planning Skills It is your job to plan a major tourist centre in this area. Facilities you should include in your plan are: a large hotel with a swimming pool; an area of small residential chalets; guest houses run by local people; a quay for boats used in water skiing and fishing; a theatre for entertainments; a tourist trail through the old town and market; a footpath to a local vantage point, where a hilltop bar can be established; closed areas of the beach where tourists can sunbathe and swim; facilities fur tourists to visit the old plantation house: car parks and access roads where necessary. Imaginary site for a tourist development on a Whitsunday island. b. Now consider the response of the local people to this development. What reaction would the following individuals have to your plan? Give their reasons for liking or disliking your plan 1. a trader in the local market; _____________________________________________________________________ 2. a fisherman in the village by the bay; _______________________________________________________ 3. a worker on the sugar cane plantation; _____________________________________________________________ 4. a local farmer producing fruit and vegetables;________________________________________________________ 5. a garage mechanic in the town;___________________________________________________________________ 6. an unemployed youth;__________________________________________________________________________ 7. a school child;_________________________________________________________________________________ 8. a wife in the fishing village.______________________________________________________________________
Code FFF A FFT F FTF H FTT I TTT L TTF T TFT U TFF W 1 The headhunters live on the west side of the mountains. 2 The buried treasure is next to a palm tree. 3 There is a cave in the rainforest. 4 The shipwreck is on the west side of the island. 5 There are mountains across the middle of the island. 6 The signal fire is on the south side of the island. 7 The headhunters live south of the rainforest. 8 There is just one rainforest on the island. 9 The quicksand is on the northern tip of the island. 10 The buried treasure lies south west from the shipwreck survivors' camp. 11 There are two caves on the island. 12 There are sixteen palm trees on the island. 13 The headhunters live east of the shipwreck survivors. 14 The signal fire is north of the shipwreck survivors' camp. 15 The signal fire is on the sandy beach. 16 The quicksand is on the south west corner of the island. 17 The caves are found to the east of the mountains. 18 The mountains run from the west to the east side of the island. 19 The headhunters' village has four huts in it. 20 The swamp is north of the quicksand. 21 The buried treasure is in a swamp. 22 The shipwreck is next to the sandy beach. 23 The shipwreck lies to the south east of the shipwreck survivors' camp. 24 There are palm trees on the south east corner of the island. Year 8 Geog Skills No. 7 Key Interpreatation What do you get if you saw a comedian in half? Above is a map with a key. The statements below are about that map. Next to each of the statements write F if it is false and T if it is true. Then use the code to find the answer to the question above.
__________________________________________________________________________________________________________________________________________ _____________________________________________________________________ 8.North Road follows part of an old caravan route. Why did the old camel routes go through ____________________________________________________________________ ____________________________________________________________________ __________________________________________________________________- 6.If you went on a gentle hike of about 15 km to Erad from Aldo, show your route with a 7.Colour in red that part of North Road where there may be danger from falling rocks. 9.Mark with an X a point from which you would have panoramic views towards the east. 4.What had to be done in the south and west of the region before roads could be 1.Which town is higher above sea level, Amar or Erad? _________________ 10. In what industry do people in the small SW settlements work? 2.Which road, West Road or North Road, would have more hills? 3.Shade in blue the section of road tourists would enjoy. 5.What approximate height above sea level is Aron? _______________________________ Year 8 Geog Skills No. 8 this part of the region? Map Interpetation constructed? green line. _
Year 8 Geog Skills No. 9 Key Skills Almost all the petrol and other oil products Australia uses are made in the country's own refineries. The largest are at Geelong (Victoria), Kurnell (Sydney), Kwinana (W.A.) and Altona (Melbourne). The biggest oilfields are Kingfish, Halibut and Barrow Island. These and others can produce about two thirds of Australia's oil needs. The rest has to be imported. Study the map below, then try to answer these questions 1. How many oil refineries does Australia have?_________________________ 2. Where do pipelines now carry crude oil long distances to refineries? ________________________________ 3. How long is the longest natural gas pipeline now in use in Australia? ________________________________ 4. Which capital cities now receive natural gas by pipeline? ________________________________ 5. Which producing oilfield is not connected to a refinery by pipeline? ________________________________ 6. Oil is a non renewable resource. What renewable resources can be use to produce energy. List as many as you can. ________________________________ ________________________________ ________________________________ ________________________________ ________________________________ ________________________________ ________________________________ ________________________________ ________________________________ ________________________________ ________________________________
Seoul Kuala Lumpur New Delhi Indian Ocean Bangkok Tokyo 1. Colour the countries using the code . Label the following places and oceans. Hong Kong Jakarta Australia and South East Asia Manila Colombo Year 8 Geog Skills No. 10 Pacific Ocean Singapore Darwin Beijing
are 30N, 31 N, 74N. and 86N. There is nothing beyond 90N. The lines .that run east and maps and globes. One set of these lines are called line of latitude. These imaginary lines run and are north of the equator are labelled by their degree and direction. For example, there In order to locate places in the world, mapmakers place imaginary lines around the earth on circumference) is the equator. It is labelled 0 *(degrees). The lines that run east and west h. 45 N e. 30 N g. 75 N a. 60 N b. 60 S f. 90 S c. 15 N east and west around the earth. The line of latitude at the earth's widest part (it's j. 30 S i. 90 N west and are south of the equator are labelled likewise. as in 45 S, 60 S, and 90 S. d. 0 Passes through Canada, Europe, and the Soviet Union Passes through Australia, Africa, and South America Passes north of Antarctica, south of South America Passes through the United States and Africa 8. _____ Passes through the United States and Europe Passes through India and Africa 10. _____ Circumference of the world 9. _____ Passes through Greenland Year 8 Geog Skills No. 11 North Pole South Pole Lines of Latitude 2. _____ 3. _____ 4. _____ 5. _____ 6. _____ 7. _____ 1. _____
also help tell location. Zero degrees longitude is the meridian running through Greenwich, England. It is labelled 0 *longitude and is called the prime meridian. The lines of longitude east of it are labelled direction. Unlike lines of latitude, lines of longitude meet. They meet at the poles. Lines of longitude 9. If you stood at 30 E, you could be in the northern or southern 11. It you stood at the prime meridian and faced west, you would labelled through 180 degrees. They become 10 W, 40 W, 90 W, and so on. The 180 degree line is 10. If you stood at 180 , you could be in the Atlantic or Pacific through 180 degrees. Thus there are 10 E, 45 E, 110 E, and 180 E. The lines west of it are also 4. 30 W passes through Greenland and the Atlantic Ocean. Lines of longitude, like those of latitude, are imaginary. They circle the globe in a northsouth 8. 120 W passes through the United States and Canada. 6. 150 E passes through the Soviet Union and Australia, 7. All of the lines pass through the South Pole. 1. The prime meridian passes through Africa. 2. 90 W passes through the Soviet Union. be looking toward the Atlantic Ocean 5. 120 E passes through Europe. 3. 180 is in the Pacific Ocean. International Date Line Topic of Capricorn Tropic of Cancer both east and west, just as 0 is both east and west. Antarctic Circle Prime Meridian Arctic Circle North Bole South Pole hemisphere. Equator Ocean. Year 8 Geog Skills No. 12 Match the correct pairs. 180 East or West long. Lines of Longitude 66 30' S. lat. F F F F F F F F F F F 66 30' N. lat. 23 27 S. lat. 23 27N. lat 90 N. lat. 90 S. lat. 0 long. O lat. T T T T T T T T T T T
Contour lines Year 8 Geog Skills No. 13 Map References/Legends Major road Minor road Embankment; cutting Bridge Railway line; Cliff Trig station; spot height Windpump Mine; quarry Swamp station Track Building Orchard or vineyard Forest; scrub School; church Sand; water State forest - pine Rock; lighthouse Rock ledge Tank Land subject to flooding 1.Describe what you can see in Area Reference : 8424__________________________________________ 8425__________________________________________ 2.Give Map References for the following: Council Chambers _______________________________ Sale Yards ____________________________________ Factory _______________________________________ High School ____________________________________ Hospital ______________________________________ Primary school __________________________________ Olympic Pool ____________________________________ Post Office ____________________________________ 3.Name the features at: 826246____________________________________ 835248____________________________________ 833276____________________________________ 826251____________________________________ 838253____________________________________ 849252____________________________________ 836245____________________________________
Year 8 Geog Skills No. 14 Key Skills Statement True or False (a) Bowen has a population of 600. (b) Cloncurry has a population of 10 850. (c) Cooktown has a population of 5856. (d) Rockhampton and Toowoomba could have similar populations (e) Mt Isa is bigger than Mt Morgan. (f) Gympie is bigger than Kingaroy. (g) Mackay has a population over 20 000. (h) Charleville and Cunnamulla are about the same size. (i) Mareeba has a population of 11 500. (j) Roma and Emerald are about the same size. (k) The Gold Coast is bigger than Brisbane. (1) Bundaberg has a population of 19 800. (m) Cairns and Mt Isa could have populations of about 32 000. (n) Longreach is smaller than 5000. (o) Ingham is bigger than Innisfail. (p) Wyandra has a population of about 200. (q) Goondiwindi and St George are about the same size. (r) Townsville has a population of 70 000. (s) Charters Towers has a population of 10 300. (t) Ipswich is bigger than Gladstone. (u) Blair Athol has less than 1000 people. (v) Winton has more than 5750 people. (w) Blackall is half the size of Townsville. (x)The Gold Coast is twice as big as Emerald. (y) Cloncurry is a large city. (z) Mackay is a small village.
Year 8 Geog Skills No. 15 Apostrophes An apostrophe and "s" are used to show ownership. eg engineer's computer For a plural noun, the apostrophe comes after the "s eg ten engineers' computer Use an apostrophe and s to rewrite these and show that these things belong together. Australia oceans __________________________________________________ A nation/ identity __________________________________________________ All citizen / rights __________________________________________________ The world/ health __________________________________________________ A country / borders _________________________________________________ 3 nation / problem __________________________________________________ An individual / rights ________________________________________________ A conservation group / actions__________________________________________ Draw a tick or a cross in the box if the apostrophe is correct. 1 . A good global citizen is well informed about the worlds' problems. 2. All citizens should respect each other's rights and property. 3. People cannot cross another country's border without permission. 4. The worlds' oceans are not owned by one particular country but are common shared areas. 5. There have been many disputes over some countrie's use of oceans for whaling. 6. Many treaties and international agreements have been made to protect the world's ocean species from being depleted. 7. An individual citizens' actions can help to promote global environmental issues. 8. The United Nation's Declaration of Human Rights sets out everyone's basic human rights, regardless of where they live. 9. A Geography student's understanding of the world's issues and problems should be continually updated by reading newspapers and watching relevant television programs. 10. International cooperation is needed to protect the Earth's environments.
____________________________________________________________________________________________________________________________________________ ______________________________________________________________________ ______________________________________________________________________ ______________________________________________________________________ ______________________________________________________________________ ______________________________________________________________________ ______________________________________________________________________ ______________________________________________________________________ ______________________________________________________________________ ______________________________________________________________________ Farmers ______________________________________________________________ The local authority ______________________________________________________ The government ________________________________________________________ Ordinary people ________________________________________________________ For each of the following groups of people, say what they might do to help clean up the river. School children ________________________________________________________ Year 8 Geog Skills No. 16 Sketch Thinking Skills
Year 8 Geog Skills No. 17a Graphs There are five main types of graphs: line graphs, column or bar graphs, histograms, pie graphs and pyramid graphs. Graphs usually present quantitative information. They may be used to present changes over time, for example birch races, to show the frequency of a particular variable by using a histogram, or to show the relationship between two variables such as height and weight as in a line graph or a column graph. Histograms, column graphs and line graphs have a vertical axis, often labelled the y axis and a horizontal axis often labelled the x axis. The dependent variable is usually plotted on the y-axis and the independent variable is plotted on the x axis. Line graphs In Fig. 2.3 the dependent variable is the number of criminal offences and the independent variable is time, as time is independent of the number of criminal offences. This graph shows a variation in the number of criminal offences over a period of time. Line graphs are useful for depicting changes over time but they must be read carefully to ensure chat the intervals on the graph have not distorted the data. That is, by increasing the size of the vertical intervals the changes can be made to appear more dramatic than they really are and similarly, by increasing the size of the horizontal intervals the changes in a variable over time will appear less obvious. Histograms Fig. 2.4 is presented as a histogram. The x axis represents intervals in terms of age groups and the y axis represents the proportion of non-family individuals living alone: those born in Australia; those born in English speaking countries and those born in Non English speaking countries. Column or bar graphs These are similar to histograms and the x axis often has the variable of time. Pie(Sector)graphs A pie graph consists of a circle divided into parts; each part representing the value o component or variable. The information is presented in a visual manner and is desirable to have the numerical proportion presented as well. Fig. 2.3 Line graph: Selected offences becoming known to police and offences cleared, 1972 73 to 1981 ,82. Fig. 2.4 Histogram
POPULATION OF AUSTRALIA TABLE 3 PROPORTION OF (per cent), 1980 AIRPORTS IN NEW TRAFFIC CARRIED, SOUTH WALES : SCHEDULED DOMESTIC SELECTED TABLE 2 1980 Table 2 Column Graph (leave a space Draw Graphs in the spaces provided. Year 8 Geog Skills No. 17b Table 3 Single Bar Graph. TABLE 1 GROWTH OF POPULATION OF NEW between the columns). Table 1 Line Graph. SOUTH WALES Graphs
Year 8 Geog Skills No. 18 Antartic Climate Scientists and explorers have done much research on the weather and climate of Antarctica. If we want to compare the weather of Antarctica with our own, we shall need to understand how we measure the elements of weather. A list of the key weather elements would include items such as: Precipitation Sunlight Hours Wind Speed Cloud Cover Wind Direction Air Pressure Humidity Air Temperature. Using the following tables, construct a graph comparing the weather of Canberra or your city or town with that of Mawson Station. Choose one or two factors to compare. For example, compare the mean temperatures of Mawson and Canberra. (Compare too many factors and the graph will be too crowded.) MAWSON STATION CANBERRA June January June January 6.4 Mean Temperature: (C) Maximum Temperature: (C) Minimum Temperature: (C) Mean Pressure: (MB) Mean Wind Speeds: (knots) Days Rain/Snow: Mean Daily Sunshine Hours: - 15.2 + 0.9 Mean Temperature: (C) Maximum Temperature: (C) Minimum Temperature: (C) Mean Pressure: (MB) Mean Wind Speed: (knots) Days Rain/Snow Mean Daily Sunshine Hours: 20.2 - 2.4 + 5.9 11.9 27.7 - 29.6 - 6.3 0.9 12.8 990.5 990.8 17.0 20.8 0.0 2.0 1020.1 IOU. 1 3.6 5.0 4.6 5.1 6.5 9.1 0.0 7.5
Year 8 Geog Skills No. 19 Graphs A Climatic Graph ( Climograph ) contains both a line graph and a bar graph, the line graph (showing temperatures) always being drawn about the bar graph (which shows rainfall). Notice that the graph has a title. All of the axes are labelled, the rainfall bars are shaded in, and that the annual rainfall is shown on the completed graph. Diagrams (or Sector Graphs) EXAMPLE: Notice that the diagram has a heading and that each of the sectors of the circle is labelled. this could be done by using a key if you wish.) The diagram could be further improved by showing the percentage of total ocean area each ocean represents. The correct way to draw a pie diagram is to start at 12 o'clock and then proceed clockwise the largest first and in descending order. Comparison of Ocean Areas TASK 2: Draw a pie diagram to show the following information. Japanese exports by areas South and East Asia 30% North America 25% Europe 15% Middle East 10% Africa 10% Australia and Oceania 5% South and Central America 5% Total Exports U.S. $55,000 million (Hint: 10% will be represented by an angle of 369 ) TASK 1: Draw a climatic graph for Adelaide using the following temperatures and rainfall figures:
Year 8 Geog Skills No. 20 Climate Graphs 1.(a) Use the climatic data given in the table on the left to draw a graph for Mawson. i. Colour the column graph for rainfall in blue ii. Draw the line connecting the temperatures in red (b) Describe the climate of the area in as much detail as possible. ___________________________________________ ___________________________________________ ___________________________________________ ___________________________________________ ___________________________________________ ___________________________________________ ___________________________________________ ___________________________________________ ___________________________________________ ___________________________________________ ___________________________________________ ___________________________________________ ___________________________________________ ___________________________________________
Year 8 Geog Skills No. 21 Text type: Recount A sequence of events can be more difficult when the events are complicated. Sometimes you need to sort through a lot of information to find the most important facts. This passage is about a geography field trip. 1. Read the passage. 2. Circle all the past tense words 3. Underline the sentences which contain important information. Our Geography Field Trip. Mr Wilson, our Geography teacher, told us about a field trip planned for all Year 9 Geography students. We were going to the beach to study a coastal ecosystem, investigating damage humans may have caused. On the day of the field trip our teachers checked off our names. We got on the bus, sang a few songs, ate some junk food and in no time we were there. It was a beautiful sunny day, warm enough for a swim. However we had many things to learn about before we could go into the water. We made several field sketches of the beach features, including the shoreline, rock formations, and types of grasses. We also noted the fine texture of the sand on the beach. We observed that parts of the path to the beach had been eroded during a recent storm. Unfortunately, there was a lot of rubbish on the beach. In our books, we noted the types of litter we saw, including plastic bottles, cans, cigarette butts and food containers. Most of the rubbish seemed to be located near a storm water canal. We concluded that during the storm, litter must have washed from the streets into the storm water canal and then onto the beach. After lunch, we had a game of beach volleyball and finally we were allowed to swim in the ocean baths. The water was crystal clear because the recent high tides had cleaned the seaweed out. On the way home the teachers gave us an observation quiz, with prizes for the winners. Our notes and diagrams were collected for marking. The next day in Geography Mr Wilson asked everyone to form small groups and prepare a short presentation about the field trip. Our presentation was titled "How pollution is destroying Australia's coastal environments and we got full marks. 4. Write the sequence of events in point form. ______________________________________________________________________________________________ ______________________________________________________________________________________________ ______________________________________________________________________________________________ ______________________________________________________________________________________________ ______________________________________________________________________________________________ ______________________________________________________________________________________________ ______________________________________________________________________________________________ ______________________________________________________________________________________________
Year 8 Geog Skills No. 22 African Desert symbols In general, the desert areas of the world have very few people living in them, except where there is an oasis or other permanent supply of water. This fact is clearly seen by looking at Africa's desert areas. 1 Carefully read the statements below and use the maps to help you tick the ones you think are true. Many people live in area A. Area A has moderate rainfall. A few scattered settlements would be found in area A. Area A has heavy rainfall. It would be easy to survive in area A. Area A is a desert. Many cities would be found in area A. The people who live in area A would probably move around in search of water. Very few people live in area A. It would be difficult to survive in area A. Area A has little rainfall. 2Carefully read the statements below and use the maps to help you tick the ones you think are true. Many people live in area B. Area B has moderate rainfall. A few scattered settlements would be found in area B. Area B has heavy rainfall. It would be easy to survive in area B. Area B is a desert. Many cities would be found in area B. The people who live in area B would probably move around in search of water. Very few people live in area B. It would be difficult to survive in area B. Area B has little rainfall.
Extra Activity: Find the following five bodies of 11.The South Pacific lies between Australia and Gulf of Mexico, (4) Barents Sea, (5) North Sea. these five. (1) Wendell Sea. (2) Yellow Sea, (3) 18.The Bering Sea lies between Alaska and the 10.The North Pacific lies between the U.S.S.R. water in an atlas or encyclopedia and add them to your map. Use a different color pen to label 12.The Arctic Ocean lies north of the U.S.S.R. 13.The Beaufort Sea lies north of Alaska and 20.Hudson Bay lies in eastern Canada, wholly 17.The Sea of Japan lies between Japan and 16.The Sea of Okhotsk lies north of Japan, 15.The Baltic Sea lies between Sweden and 19.The Caribbean Sea lies north of South 14.Baffin Bay lies between Greenland and America and east of Central America. surrounded by land of the U.S.S.R. surrounded by Canadian territory. and North America. South America. and Canada. U.S.S.R. Canada. Canada. Poland. Korea. different names. They also have different In reality there is only one ocean, since all different sections of this ocean are given 1.The North Atlantic lies between Europe 2.The South Atlantic lies between Africa 4.Northeast of the Mediterranean is the the Pacific. Use the clues on this page to 5.Southeast of the Mediterranean is the example, is rough and cold compared to B.The Bay of Bengal lies between India 3.The Mediterranean Sea lies between 6.Between Africa, India, and Australia 9.The Coral Sea lies east and north of northern Africa and southern Europe. the oceans are connected. However. Australia, but south of New Guinea. 7.Between India and Arabia is the characteristics. The Atlantic, for label the oceans on Master 26. Year 8 Geog Skills No. 23 Place Location Oceans lies the Indian Ocean. and North America. and South America. narrow Red Sea. and Thailand. Arabian Sea. Black Sea.
1.By the river the land is not well drained and the paddocks are grass. These are their 2.The following are market gardens, find them and colour them purple: The rest of the land is ploughed and should be brown, (q)4245 (s)5235 r)4535 (m)3070 (o)3060 (n)3067 (h)6045 (p)3555 (g)5055 (u)6536 (9)1575 (e)5038 (f)5042 (t)6545 (1)3078 (j)2075 (e)1355 (k)1555 (i)2168 (f)1565 and the open spaces in the town. Year 8 Geog Skills No. 24a 3.This is moorland (yellow): and colour them green: references. find them (d)5350 (h)2263 (e)2545 (g)2550 (f)2055 (c)5348 (d)1540 (c)1525 and by the school Map Reading Land Use (b)3020 (d)3040 (b)5346 (b)6570 (c)3030 (a)5344 (a)6555 (a)1515 4.
Year 8 Geog Skills No. 24b Map Reading First complete this key with the symbols used in this map: Churches Signal Box Embankment Marsh Quarry Map References Notice that the straight lines on the map, called the grid, are numbered for reference. The end of the jetty has the reference 4/1 as the bottom number should be read first. To be more accurate we can imagine the space between the lines to be divided into tenths. The house marked 'Ho' will then have a map reference 2.5/1.5 or, as it is more usually given 2515. The quarry at the top is 6775 (6.7/7.5) and the railway station is 5040. Write the map references of the following: The signal box ______________The school._______________ The island _____________ The railway bridges ________________ Which objects are situated at these points ?: 6030______________ 2667__________________ 5020 _____________ 1838__________________5523______________ 5757_______________________ Distance To measure distance fairly accurately use a pair of compasses and set them at 250m, using tie scale on the map, then walk them along the road counting every step as 250m. What are the following distances by road or track ?: 1. From the railway station to the quarry _________________________________ 2. From the railway station to the village (5560) ____________________________ 3. From the school to the house 'Ho' (a) using the ferry ______________________________ (b) going by road _______________________________ Direction Measurements for direction are in a straight line, not along roads. What are the following buildings?: 1. One km East of the farm 2030 __________________ 2. Half a km North of the lighthouse________________ Pond Lighthouse School Railway Ferry Terminus
10. The TAB from the post office? _________20. The baker from the barber? _________ 1. The playground from the oval?___________11. The supermarket from the wharf? ______ 9. The butcher from the supermarket? _______19. The bank from the playground? ______ 5. The newsagent from the dentist? _________15. The bridge from the car park? ______ 6. The bridge from the newsagent? ________16. The station from the chemist? _______ 4. The library from the playground? ________14. The dentist from the garage? _______ 2. The newsagent from the post office?_______12. The oval from the station? ________ 7. The oval from the car park? _________17. The oval from the post office? _______ 8. The park from the library? ________18. The butcher from the garage? ________ 3. The station from the houses? _________13. The station from the bank? _______ The main points of the compass are north, south, east and west. When doing this exercise always remember to start at the place The angle between the four main points is 90 degrees; the angle north-east and south east, and north west and south west. They are easily remembered as they are north of east, or north of However, there are points between each of these. They are between the 8 points is only 45 degrees. that is mentioned after the word FROM. west, or south of east or south of west. Year 8 Geog Skills No. 25 What direction is . Direction Exercise
Year 8 Geog Skills No. 26 Topographical Maps 1. Write each of the letters on the map in the appropriate space below. What are the grid references of the places below? a. House ________________________________ b. Main road _____________________________ c. Orchard or vineyard _____________________ d. Swamp _______________________________ e. Cutting _______________________________ f. Embarkment ___________________________ g. Dam _________________________________ h. Mine _________________________________ i. Pine plantation __________________________ j. Bridge ________________________________ 2. What are the grid references of the places below? a. Police station __________________________ b. School _______________________________ c. Post Office ___________________________ d. Dam _________________________________ e. Mine _________________________________ EXTENSION 1Which is higher above sea level: a The mine or the top of the railway cutting? b The pine plantation or the church? c The dam or the post office? 2What is the length of the section of railway shown on the map? _________________________________________
Exercise 2 What size is: Paddock 3? ____________________ The garden?___________________ Exercise 3 a. These distances involve half a centimetre which is a real distance of 50 metres. e.g. 2 cm=250 metres and 11 cm=1150 metres. What is the distance from:- 1. Trough 4 to dairy? _____________________________ 2. Gate 4 to gate 2? _____________________________ 3. Gate 5 to car shed? _____________________________ 4. Trough 3 to trough 2? _____________________________ 5. Main gate to trough 2? _____________________________ c. Paddock 5 to paddock 2? ___________________________ d. The main gate to the house? ___________________________ e. The garden to paddock 1? ___________________________ f. The house to the garden gate? ___________________________ g. The dairy to paddock 5? ___________________________ h. The house to trough 1? ___________________________ i. Gate 4 to trough 1? ___________________________ j. Trough 3 to trough 4? ___________________________ Year 8 Geog Skills No. 27 Scale Exercise 1 How far is the shortest route from: a. Trough 3 to trough 1? ___________________________ b. Trough 1 to trough 2? ___________________________
Year 8 Geog Skills No. 28 Map Jigsaw Cut out the jigsaw and put it together. Label what you can. States cities, oceans and seas C
Year 8 Geog Skills No. 29 Map Jigsaw Cut out the jigsaw and put it together. Label what you can. States cities, oceans and seas
Year 8 Geog Skills No.30 Graphs Interpretation Look at the graph showing mobile phone use by age [8.8]. 1. What does the graph tell you about mobile phone use and age? ______________________________________________________ ______________________________________________________ 2.Which age group has the highest use? _______________________ 3. Suggest reasons for this. ________________________________ ______________________________________________________ 4.Which age group has the least use?__________________________ 5.Suggest reasons for this. _________________________________ ______________________________________________________ 6.What is the total use of mobile phones between the age of 14 and 24? ______________________________________________________ 7.What is the scale used on this graph? ________________________ Look at the graph showing Major Cities in Malaysia [9.17]. 1.What is Malaysia s largest city? ____________________________ 2.What is Malaysia s smallest city?____________________________ 3.What is the total population of the 5 listed cities? ______________________________________________________ 4.What is the difference in population between Kuala Lumpur and Petaling Jaya?___________________________________________ 5.Which city would likely to be the Capital of Malaysia? Why ________________________________________________________ ________________________________________________________ Extension Activity: Use the following Data, draw a column graph Australia s Population By State & Territory June 2009 ( 000) ACT 351 Northern Territory Tasmania 502 South Australia Queensland 1 622 4 406 224 New South Wales 7 099 Western Australia 2 237


 _________________")