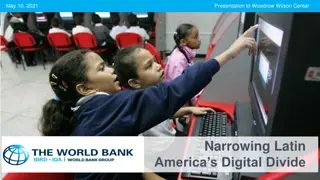
Challenges and Opportunities for Youth in Latin America and the Caribbean
The focus on youth in Latin America and the Caribbean is crucial due to the demographic window of opportunity that is still open. Despite being more educated and belonging to the middle class, young people face limited opportunities, leading to challenges in employment prospects. Gender gaps persist, although they have decreased over time. Addressing youth inclusion can drive inclusive growth in the region, emphasizing the importance of skills and entrepreneurship for sustainable development.

Download Presentation

Please find below an Image/Link to download the presentation.
The content on the website is provided AS IS for your information and personal use only. It may not be sold, licensed, or shared on other websites without obtaining consent from the author. Download presentation by click this link. If you encounter any issues during the download, it is possible that the publisher has removed the file from their server.
E N D
Presentation Transcript
Youth, Skills and Entrepreneurship in Latin America and the Caribbean Angel Melguizo and Paula Cerutti OECD Development Centre OAS Towards Concrete Solutions for Addressing Youth Employment in the Caribbean December 6 2017, Barbados
Overview 1 Youth inclusion in Latin America and the Caribbean 2 Skills and entrepreneurship for inclusive growth
Why focus on youth? The Latin American and Caribbean demographic window of opportunity is still open but not much is left Youth are more educated than adults and an increasing share belongs to the middle class however, they are offered limited opportunities The inclusion of young people in the social, economic and political processes can spur inclusive growth
Large share of young population opens a window of opportunity One-quarter of the Caribbean population is aged between 15-29 Young population in the Caribbean (in millions) Young population (15-29) Young over pop. aged (30-100+) 12 0.9 0.8 10 0.7 8 0.6 0.5 6 0.4 4 0.3 0.2 2 0.1 0 0 2010 1950 1955 1960 1965 1970 1975 1980 1985 1990 1995 2000 2005 2015 2020 2025 2030 2035 2040 2045 2050 2055 2060 2065 2070 2075 2080 2085 2090 2095 2100 Source: OECD/ECLAC/CAF, based on United Nations, Population Division, (2015), World Population Prospects, The 2015 Revision
However, many of them lack of good employment prospects today Activity status of youth by gender in Latin America and the Caribbean, 2014 (% of youth aged 15-29) Source: OECD/ECLAC/CAF, Latin American Economic Outlook 2017: Youth, Skills and Entrepreneurship. OECD and World Bank tabulations of SEDLAC (CEDLAS and the World Bank).
Gender gaps havedecreased, but still persist Population without own income by sex, 2014 (% of youth aged 15-24) Labour force participation by sex, 2017 (% of youth aged 15-24) Male Female Men Women 65 70 60 65 55 60 50 55 45 50 45 40 40 35 35 30 30 25 25 20 20 15 Trinidad and Saint Vincent 15 Barbados Jamaica LAC DR Saint Lucia Cuba Haiti Suriname Bahamas Costa Rica Colombia Mexico DR LAC Guatemala Brazil Panama El Salvador Ecuador Source: OECD/ECLAC/CAF, Latin American Economic Outlook 2017: Youth, Skills and Entrepreneurship. OECD and World Bank tabulations of SEDLAC (CEDLAS and the World Bank).
Disconnected youth need to be re-engaged Activity status of youth by single year of age and socio-economic status, 2014 Working student Student NEET Worker Extreme poor Moderate poor 100% 100% 80% 80% 60% 60% 40% 40% 20% 20% 0% 0% 15 16 17 18 19 20 21 22 23 24 25 26 27 28 29 15 16 17 18 19 20 21 22 23 24 25 26 27 28 29 Age Age Vulnerable Middle class 100% 100% 80% 80% 60% 60% 40% 40% 20% 20% 0% 0% 15 16 17 18 19 20 21 22 23 24 25 26 27 28 29 15 16 17 18 19 20 21 22 23 24 25 26 27 28 29 Age Age Note: Socio-economic classes are defined using the World Bank classification: Extreme poor = youth belonging to households with a daily per capita income lower than USD 2.50. Moderate poor = USD 2.50-4.00. Vulnerable = USD 4.00-10.00 Middle class = higher than USD 10.00. Poverty lines and incomes are expressed in 2005 USD PPP per day (PPP = purchasing power parity). LAC weighted average of 17 countries: Argentina, Bolivia, Brazil, Chile, Colombia, Costa Rica, Dominican Republic, Ecuador, El Salvador, Guatemala, Honduras, Mexico, Nicaragua, Panama, Paraguay, Peru, Uruguay Source: OECD and World Bank tabulations of SEDLAC (CEDLAS and the World Bank).
particularly the ones with lower socio-economic background (i.e. poor and vulnerable) Activity status of youth by single year of age and socio-economic status, 2014 Vulnerable Middle Class Vulnerable Middle class % % 100 100 NEET 90 90 NEET Informal Worker 80 80 70 70 Informal Worker Formal Worker 60 60 50 50 Formal Worker 40 40 Working student 30 30 Working student 20 20 Student Student 10 10 0 0 15 16 17 18 19 20 21 22 23 24 25 26 27 28 29 15 16 17 18 19 20 21 22 23 24 25 26 27 28 29 Age Age Note: Socio-economic classes are defined using the World Bank classification: Extreme poor = youth belonging to households with a daily per capita income lower than USD 2.50. Moderate poor = youth belonging to households with a daily per capita income of USD 2.50-4.00. Vulnerable = individuals with a daily per capita ncome of USD 4.00-10.00 Middle class = youth from households with a daily per capita income higher than USD 10.00. Poverty lines and incomes are expressed in 2005 USD PPP per day (PPP = purchasing power parity). OECD is the unweighted average of countries shown. LAC weighted average of 17 countries: Argentina, Bolivia, Brazil, Chile, Colombia, Costa Rica, Dominican Republic, Ecuador, El Salvador, Guatemala, Honduras, Mexico, Nicaragua, Panama, Paraguay, Peru, Uruguay Source: OECD and World Bank tabulations of SEDLAC (CEDLAS and the World Bank).
Informality: stepping stone or trap? Flows into and out of informality of youth in Latin America (male workers, % annual flows, 2005-15) Note:This analysis covers urban populations in four countries (Argentina, Brazil, Mexico, Peru) due to data limitations Source: OECD/ECLAC/CAF, Latin American Economic Outlook 2017: Youth, Skills and Entrepreneurship. OECD and World Bank tabulations of LABLAC (CEDLAS and the World Bank).
Plenty of (own-account) entrepreneurs mostly from disadvantaged backgrounds Distribution of employed population by occupational category in LAC and the OECD (aged 15-29 years, 2014) Unpaid family worker Employee Employer Own-account % 100 90 80 70 60 50 40 30 20 10 0 Peru Brazil Colombia Mexico Dominican R. Bolivia Uruguay Costa Rica Haiti Honduras Ecuador Paraguay Argentina Chile LAC average Panama El Salvador Guatemala Nicaragua OECD average Source: OECD and World Bank tabulations of SEDLAC (CEDLAS and the World Bank).
Few high-growth and many subsistence young entrepreneurs in LAC Entrepreneurial motivation in LAC and OECD, Necessity or opportunity (2015, %) Young - necessity Adult - necessity Young - opportunity Adult - opportunity 1.0 0.9 0.8 0.7 0.6 0.5 0.4 0.3 0.2 0.1 0.0 Source: OECD/ECLAC/CAF, Latin American Economic Outlook 2017: Youth, Skills and Entrepreneurship , based on Global Entrepreneurship Monitor individual data, 2015 and Herrington, Kelley and Singer (2016).
Young entrepreneurs integration into global value chains is still limited Entrepreneurs with at least of revenues from international customers (2014, %) Adult Young % 50 45 40 35 30 25 20 15 10 5 0 Guatemala Chile Brazil LAC average Mexico Panama Colombia Uruguay Ecuador Barbados Argentina Puerto Rico Peru OECD average Source: OECD/ECLAC/CAF, Latin American Economic Outlook 2017: Youth, Skills and Entrepreneurship , based on Global Entrepreneurship Monitor individual data, 2015.
There is a wide gap between skills demand and supply Firms reporting difficulties to hire qualified staff (average 2006-2016, %) 80 70 60 50 40 30 20 10 0 Source: OECD/ECLAC/CAF, Latin American Economic Outlook 2017: Youth, Skills and Entrepreneurship , based on Manpower Group databases
and many workers perform jobs that are mismatched with the skills they have Qualification of workers according to a normative measure of mismatch based on years of education required by the type of job they perform (2014, %) Underqualified Qualified Overqualified El Salvador* Latin America and Caribbean Dominican Republic Peru Colombia* Jamaica % 0 20 40 60 80 100 Note: Caluclations based on School-to-Work Transition Surveys 2012-2015, ILO. The normative mismatch measure is based on a mapping of ISCO-08 major groups to ISCED skills levels as follows. An individual working in a high-skilled occupation (ISCO 1-3) should have completed at least some tertiary education, an individual working in a medium-skilled occupation (ISCO 4-8) should have completed (general or vocational) secondary education and an individual working in a low-skilled occupation (ISCO 9) should have completed at least primary education. These individuals are considered as adequately qualified and, if this is not the case, they enter into the over- or underqualified category. Data for Colombia and El Salvador refer to the urban population only. Source: OECD, 2017: Youth Aspirations and the Reality of Jobs in Developing Countries: Mind the gap.
Overview 1 Youth inclusion in Latin America and the Caribbean 2 Skills and entrepreneurship for inclusive growth
Secondary education coverage has increased especially for vulnerable, but quality remains low Average increase in years of education by socio-economic group and age group, 2004-14 Youth by highest level of education achieved in LAC (% of youth aged 25-29) Source: OECD and World Bank tabulations of SEDLAC (CEDLAS and the World Bank). Source: OECD and World Bank tabulations of SEDLAC (CEDLAS and the World Bank).
Tertiary education enrolment has increased, but graduation rates remain low Gross enrolment ratio, tertiary education, LAC-16 (%) 100 90 80 70 60 50 40 30 20 10 0 LAC Antigua and Barbuda Bermuda Jamaica Dominican Republic Aruba Saint Lucia OECD Haiti Saint Kitts and Nevis Grenada Belize Cuba Note: Gross enrolment ratio refers to the number of students enrolled in a given level of education, regardless of age, expressed as a percentage of the official school-age population corresponding to the same level of education. Year is 2014 except forArgentina, Chile, El Salvador, Ecuador, Jamaica, Guatemala, Mexico, OECD and Panama (2013), and Paraguay, Peru and Uruguay (2010). Source: UNESCO Institute for Statistics. Gross enrolment ratio, tertiary, both sexes (percentage).
and few students focus in Science, Engineering & Mathematics, despite their higher economic returns Tertiary students enrolled in STEM programmes in Latin America, circa 2013 (share) 0.6 0.5 0.4 0.3 0.2 0.1 0 Source: OECD/ECLAC/CAF, Latin American Economic Outlook 2017: Youth, Skills and Entrepreneurship
Technical and vocational edu. has not developed to its full potential due (in part) to limited budgets Public expenditure in training programmes in Latin America (circa 2014; % GDP) Note:2014 for Argentina, Brazil, OECD and Panama; 2013 for Costa Rica, Guatemala and Peru; 2012 for M xico; 2011 for Chile and Ecuador; and 2010 for Colombia Source: OECD/ECLAC/CAF, Latin American Economic Outlook 2017: Youth, Skills and Entrepreneurship
Programs for disadvantage youth work when combining class-work, intermediation and demand Components and outcomes in youth training programmes in Latin America
Barriers to entrepreneurship in LAC are higher than in emerging economies and the OECD Barriers to entrepreneurship index (Scale 0 to 6 from least to most restrictive, 2013) Complexity of regulatory procedures Administrative burdens on start-ups 4.5 4.0 3.5 3.0 2.5 2.0 1.5 1.0 0.5 0.0 Costa Rica Peru Panama Paraguay Mexico Uruguay Jamaica Ecuador Honduras Dominican Republic Brazil Argentina LAC average Chile Nicaragua Bolivia Venezuela Guatemala El Salvador Colombia OECD average Source: OECD/ECLAC/CAF, Latin American Economic Outlook 2017: Youth, Skills and Entrepreneurship , based on PMR databases (OECD and WB)
Entrepreneurship programmes offering business training, mentoring and counselling work Components and final outcomes in youth entrepreneurship programmes in LAC Source: OECD/ECLAC/CAF, Latin American Economic Outlook 2017: Youth, Skills and Entrepreneurship , based on programnmes evaluations
LatinAmericaEconomicOutlook2017 Beyond the short-term, Latin America and the Caribbean face a triple challenge: economic (productivity), social (poverty and vulnerability) and political (governance) Structural policies should be accompanied by investment in human and physical capital to spur Empowering the youth based on skills and entrepreneurship policies should be in the agenda
The way forward skills and educational policies Strengthen the education system and promote lifelong skills-enhancing programmes Combine classroom teaching with practical on-the-job training Collect information on the skills of the population and those demanded by businesses to build better national skills-enhancing strategies Develop skills programmes that are more responsive to the needs of the marketplace
The way forward entrepreneurship policies Reduce regulatory barriers for young entrepreneurs Introduce tailored financing instruments adapted to the needs of young entrepreneurs, Strengthen the link of young entrepreneurs with business networks Support business training and mentoring programmes Apply systematic evaluations of youth training and entrepreneurship programmes to identify what works and what needs to be redesigned.
Some promising programmes in the region and the Caribbean Dual Training: Juventud y Empleo (DR), ENTRA 21 (LAC), NEO- Jamaica (Jamaica), ProJoven (Peru) Training Institutes/Programs: SENA (Colombia), PRONATEC (Brasil), Caribbean Association of National Training Agencies (CANTA) Business registration: Ley de Emprendedores (Argentina) Flexible financing instruments: Startup Jamaica, M xico Emprende, Start-up Peru, Start-up Chile. Mentoring and training: Entrepreneurship Program for Innovation in the Caribbean, Entrepreneurship parks (Colombia), Foro Emprezando (Mexico) Internationalization: Pacific Alliance Start-up association
Policies should look into the future, both in design and financing Future of jobs: job creation or destruction? A shifting demand for skills Future of politics: new ways of connecting societies and governments. The future of cities: living in a highly urbanized region. Scale up social entrepreneurship
Much to gain from empowering the youth Economic impact of skills and entrepreneurship policies (2014; % GDP) Opportunity cost of NEETs Opportunity cost of informal youth 10 9 8 7 6 5 4 3 2 1 0 Source: OECD Development Centre, based on OECD/ECLAC/CAF, Latin American Economic Outlook 2017: Youth, Skills and Entrepreneurship.
Policies should look into the future, both in design and financing How do countries National Qualifications Strategies coordinate with each other? Do countries work/collaborate in skills demand forecasting? What are countries doing to endow with more prestige to TVET education? Data and Statistics?
Latin American Outlook 2017 Youth, Skills and Entrepreneurship Visit www.latameconomy.org Gracias!


 entrepreneurs mostly")