Year 8 Autumn 2 Work

Year 8
Autumn 2 Work

Below are the topics being covered this half
term
W
e
b
s
i
t
e
D
e
t
a
i
l
s
Watch the linked videos and use the linked worksheets
There are also videos you can watch on the Dr Frost Maths Website
www.drfrostmaths.com
Once you have logged in. At the top click “Resources” and the “Videos”
You will then need to search for the video you need
Week 1,2 & 3 Working in the cartesian plane
•
https://vimeo.com/468128782
Work with coordinates in all four quadrants
https://vimeo.com/468128960
Identify and draw lines that are parallel to the axes
•
https://vimeo.com/468129042
Recognise and use the line y=x
•
https://vimeo.com/468129177
Recognise and use lines of the form y=kx
•
https://vimeo.com/468129392
Link y=kx to direct proportion problems
•
https://vimeo.com/468129575
Explore the gradient of the line y=kx (Set 1)
•
https://vimeo.com/471425142
Recognise and use lines of the form y=x+a
•
https://vimeo.com/471425256
Explore graphs with negative gradient (y=-kx, y=a-x,
x+y=a)
•
https://vimeo.com/474984117
Link graphs to linear sequences
•
https://vimeo.com/474984412
Plot graphs of the form y=mx+c
•
https://vimeo.com/474984655
Explore non-linear graphs (H)
•
https://vimeo.com/475137972
Find the midpoint of a line segment (H)
Worksheets and solutions
Follow the link and select the worksheet with same name as the
video, then mark your work using the answer sheet.
https://mayfieldschoolpo2.sharepoint.com/Maths-
Students/Shared%20Documents/Forms/AllItems.aspx?viewid=b0f0f79c%2D1fda%2D445d%2Daf
b4%2D70da31862b4d&id=%2FMaths%2DStudents%2FShared%20Documents%2FYear%208%2F
Autumn%202%2FWorking%20in%20the%20Cartesian%20Plae
W
e
e
k
4
&
5
R
e
p
r
e
s
e
n
t
i
n
g
d
a
t
a
•
https://vimeo.com/477518878
Draw and interpret scatter graphs
•
https://vimeo.com/477519085
Understand and describe linear correlation
•
https://vimeo.com/477519379
Draw and use line of best fit
•
https://vimeo.com/477519564
Identify non-linear relationships
•
https://vimeo.com/478901964
Identify different types of data
•
https://vimeo.com/481135393
Read and interpret ungrouped frequency tables
•
https://vimeo.com/481136083
Read and interpret grouped frequency tables
•
https://vimeo.com/481136452
Represent grouped discrete data
•
https://vimeo.com/481136693
Represent continuous data grouped into equal classes
•
https://vimeo.com/481137122
Construct and interpret two-way tables
W
e
e
k
4
&
5
R
e
p
r
e
s
e
n
t
i
n
g
d
a
t
a
Worksheets and solutions
Follow the link and select the worksheet with same name as the video, then mark your work using the answer sheet.
https://mayfieldschoolpo2.sharepoint.com/Maths-
Students/Shared%20Documents/Forms/AllItems.aspx?viewid=b0f0f79c%2D1fda
%2D445d%2Dafb4%2D70da31862b4d&id=%2FMaths%2DStudents%2FShared%2
0Documents%2FYear%208%2FAutumn%202%2FCollecting%20and%20Representi
ng%20Data
W
e
e
k
6
T
a
b
l
e
s
a
n
d
p
r
o
b
a
b
i
l
i
t
y
Videos, Worksheets and solutions
Follow the link and select a video to watch, then select the worksheet with same name as the video. Mark your work
using the answer sheet.
https://mayfieldschoolpo2.sharepoint.com/Maths-
Students/Shared%20Documents/Forms/AllItems.aspx?viewid=b0f0f79c%2D1fda%2D
445d%2Dafb4%2D70da31862b4d&id=%2FMaths%2DStudents%2FShared%20Docum
ents%2FYear%208%2FAutumn%202%2FTables%20and%20Probability
W
e
e
k
7
•
Use this week to revise the
topics covered from the previous
6 weeks.
•
Re watch any videos and
complete any worksheets not
finished.
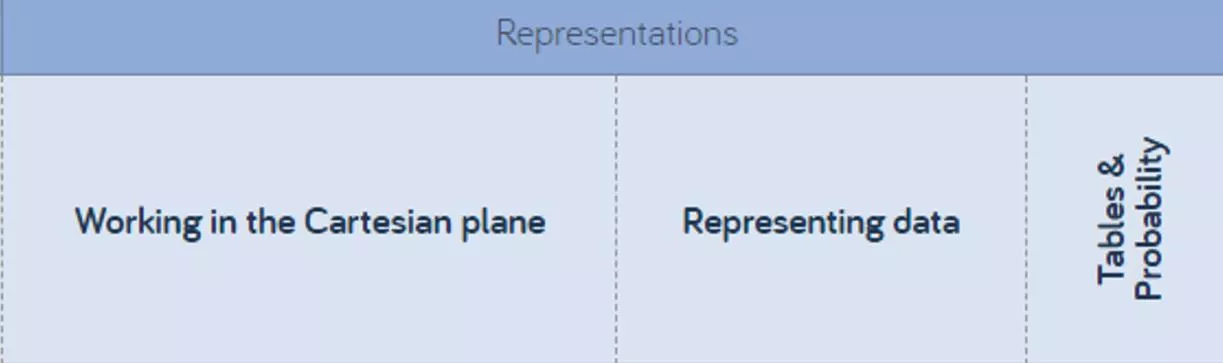
In this term, students will focus on working in the Cartesian plane, understanding linear correlations, interpreting data through scatter graphs, and more. The curriculum includes exploring coordinate systems, identifying parallel lines, plotting linear and non-linear graphs, and interpreting frequency tables. Worksheets and solutions are provided for each topic to reinforce learning. Students are encouraged to utilize online resources and watch instructional videos to enhance their understanding of mathematical concepts.

Download Presentation

Please find below an Image/Link to download the presentation.
The content on the website is provided AS IS for your information and personal use only. It may not be sold, licensed, or shared on other websites without obtaining consent from the author.If you encounter any issues during the download, it is possible that the publisher has removed the file from their server.
You are allowed to download the files provided on this website for personal or commercial use, subject to the condition that they are used lawfully. All files are the property of their respective owners.
The content on the website is provided AS IS for your information and personal use only. It may not be sold, licensed, or shared on other websites without obtaining consent from the author.
E N D
Presentation Transcript
Year 8 Autumn 2 Work
Website Details Website Details Watch the linked videos and use the linked worksheets There are also videos you can watch on the Dr Frost Maths Website www.drfrostmaths.com Once you have logged in. At the top click Resources and the Videos You will then need to search for the video you need
Week 1,2 & 3 Working in the cartesian plane https://vimeo.com/468128782 Work with coordinates in all four quadrants https://vimeo.com/468128960 Identify and draw lines that are parallel to the axes https://vimeo.com/468129042 Recognise and use the line y=x https://vimeo.com/468129177 Recognise and use lines of the form y=kx https://vimeo.com/468129392 Link y=kx to direct proportion problems https://vimeo.com/468129575 Explore the gradient of the line y=kx (Set 1) https://vimeo.com/471425142 Recognise and use lines of the form y=x+a https://vimeo.com/471425256 Explore graphs with negative gradient (y=-kx, y=a-x, x+y=a) https://vimeo.com/474984117 Link graphs to linear sequences https://vimeo.com/474984412 Plot graphs of the form y=mx+c https://vimeo.com/474984655 Explore non-linear graphs (H) https://vimeo.com/475137972 Find the midpoint of a line segment (H)
Worksheets and solutions Follow the link and select the worksheet with same name as the video, then mark your work using the answer sheet. https://mayfieldschoolpo2.sharepoint.com/Maths- Students/Shared%20Documents/Forms/AllItems.aspx?viewid=b0f0f79c%2D1fda%2D445d%2Daf b4%2D70da31862b4d&id=%2FMaths%2DStudents%2FShared%20Documents%2FYear%208%2F Autumn%202%2FWorking%20in%20the%20Cartesian%20Plae
Week 4 & 5 Representing data Week 4 & 5 Representing data https://vimeo.com/477518878 Draw and interpret scatter graphs https://vimeo.com/477519085 Understand and describe linear correlation https://vimeo.com/477519379 Draw and use line of best fit https://vimeo.com/477519564 Identify non-linear relationships https://vimeo.com/478901964 Identify different types of data https://vimeo.com/481135393 Read and interpret ungrouped frequency tables https://vimeo.com/481136083 Read and interpret grouped frequency tables https://vimeo.com/481136452 Represent grouped discrete data https://vimeo.com/481136693 Represent continuous data grouped into equal classes https://vimeo.com/481137122 Construct and interpret two-way tables
Week 4 & 5 Representing data Week 4 & 5 Representing data Worksheets and solutions Follow the link and select the worksheet with same name as the video, then mark your work using the answer sheet. https://mayfieldschoolpo2.sharepoint.com/Maths- Students/Shared%20Documents/Forms/AllItems.aspx?viewid=b0f0f79c%2D1fda %2D445d%2Dafb4%2D70da31862b4d&id=%2FMaths%2DStudents%2FShared%2 0Documents%2FYear%208%2FAutumn%202%2FCollecting%20and%20Representi ng%20Data
Week 6 Tables and probability Week 6 Tables and probability Videos, Worksheets and solutions Follow the link and select a video to watch, then select the worksheet with same name as the video. Mark your work using the answer sheet. https://mayfieldschoolpo2.sharepoint.com/Maths- Students/Shared%20Documents/Forms/AllItems.aspx?viewid=b0f0f79c%2D1fda%2D 445d%2Dafb4%2D70da31862b4d&id=%2FMaths%2DStudents%2FShared%20Docum ents%2FYear%208%2FAutumn%202%2FTables%20and%20Probability
Week 7 Week 7 Use this week to revise the topics covered from the previous 6 weeks. Re watch any videos and complete any worksheets not finished.