Washoe County Investment Committee
The Washoe County Investment Committee recently discussed key principles for public fund investment programs, emphasizing the importance of long-term income generation, asset/liability matching, and prudent diversification. The presentation highlighted benchmarking strategies, budget stability considerations, and the impact of GASB 31 on total returns. Comptroller's report provides insights into financial performance.
Download Presentation

Please find below an Image/Link to download the presentation.
The content on the website is provided AS IS for your information and personal use only. It may not be sold, licensed, or shared on other websites without obtaining consent from the author.If you encounter any issues during the download, it is possible that the publisher has removed the file from their server.
You are allowed to download the files provided on this website for personal or commercial use, subject to the condition that they are used lawfully. All files are the property of their respective owners.
The content on the website is provided AS IS for your information and personal use only. It may not be sold, licensed, or shared on other websites without obtaining consent from the author.
E N D
Presentation Transcript
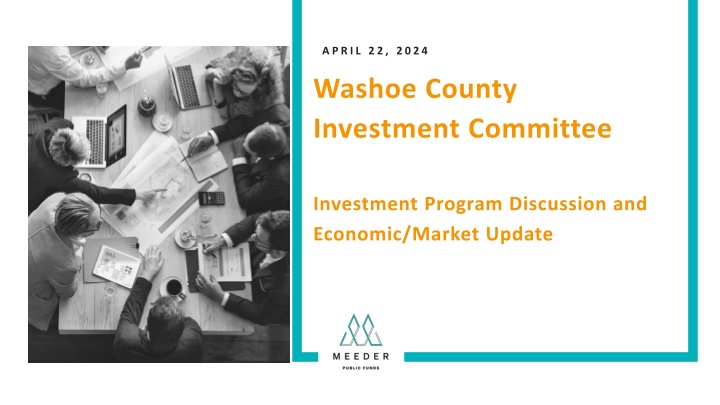
A P R IL 22, 2024 Washoe County Investment Committee Investment Program Discussion and Economic/Market Update
12 Paramount Principles of Public Fund Investment Programs 1. Longer Duration Will Generate More Investment Income Over the Long Run 2. A Detailed Asset/Liability Matching Model (aka: Cash Flow Model) is a Must 3. Interest Rate Risk (WAM/Duration) Should Match Cash Flow Metrics 4. Credit Can Enhance Income, But Duration is the Bigger Determinant of Income 5. Prudent Diversification Among Asset Classes and Investment Types and Maturities 6. You, I Nor Anyone Else Can Time the Market Accurately Over the Long Run 7. Limit Optionality (Callables) in the Portfolio 8. The Goofiness of GASB 31 Gains are Bad and Losses are Good! (The Unrealized Kind) 9. Understand the Risks of Funds in LGIPs and Other Pools (JPAs, Bond Funds, Etc.) 10. Follow GAAP (Generally Accepted Accounting Principles) 11. Benchmark Your Investment Program and Portfolio in Multiple Ways 12. Tell the Story: Provide Quality, Timely, Transparent Reporting Employing Probable Expectations: Increasing the Likelihood of Long-Term Success For the Investment Program (SLI-Safety, Liquidity, Income) Principal Preservation > Investment Income The Investment Portfolio is the Only Place in Local Government Where Revenue Can Be Generated Without Assessing Taxes or Fees 2 FOR INFORMATIONAL PURPOSES ONLY. SEE IMPORTANT DISCLOSURES AT THE END OF THE PRESENTATION.
Benchmark Your Investment Program and Portfolio in Multiple Ways 1. How does the Investment Program compare to the Investment Policy (SLI) 2. Safety: Interest rate risk, credit risk, asset allocation, structure types 3. Liquidity: Cash flow analysis 4. Income: Weight yield, book return, total return Governing Body + Accrued/Received Interest +/- Amortization of Premiums/Discounts +/- Realized Gains/Losses Average Daily Book Balance for the Period Book Return = + Accrued/Received Interest +/- Realized/Gains Losses +/- Unrealized Gains/Losses Average Daily Time Weighted Value for the Period Total Return = 3 FOR INFORMATIONAL PURPOSES ONLY. SEE IMPORTANT DISCLOSURES AT THE END OF THE PRESENTATION.
Book Return vs. Total Return: Budget StabilityGood Luck Budgeting Total Return 3.5% Source: Bloomberg 4 FOR INFORMATIONAL PURPOSES ONLY. SEE IMPORTANT DISCLOSURES AT THE END OF THE PRESENTATION.
GASB 31 and Total Return are Like Running Your Homes Market Value Changes Through Your Checking Account! 5 FOR INFORMATIONAL PURPOSES ONLY. SEE IMPORTANT DISCLOSURES AT THE END OF THE PRESENTATION.
FIGEY Model of Interest Rates: Fed, Inflation, Growth, EmploymentYields Federal Reserve Policy Inflation Growth (GDP) Employment Yields 9 FOR INFORMATIONAL PURPOSES ONLY. SEE IMPORTANT DISCLOSURES AT THE END OF THE PRESENTATION.
Economic Growth The U.S. economy grew much faster than expected in the third and fourth quarters of 2023. Economists and strategists surveyed by Bloomberg expect GDP to slow below trend during 2024. This slowing growth is due to a few factors; one primary one is less stimulus from the federal government as compared to the previous few years. The estimates for the decline in GDP has been one of the contributors to lower intermediate-term interest rates since last October. 10 10 SOURCE: BLOOMBERG FOR INFORMATIONAL PURPOSES ONLY. SEE IMPORTANT DISCLOSURES AT THE END OF THE PRESENTATION.
Job Market The U.S. employment sector remains fairly robust. The U.S. economy has experienced 39 consecutive months of job growth. The 3-month average job growth has accelerated since the later part of last year. Job openings have declined, but remain well above pre- pandemic levels. The healthy job market has helped keep consumer spending at a high level. 11 11 SOURCE: BLOOMBERG FOR INFORMATIONAL PURPOSES ONLY. SEE IMPORTANT DISCLOSURES AT THE END OF THE PRESENTATION.
Job Market 12 12 SOURCE: BLOOMBERG FOR INFORMATIONAL PURPOSES ONLY. SEE IMPORTANT DISCLOSURES AT THE END OF THE PRESENTATION.
Job Market 13 13 SOURCE: BLOOMBERG FOR INFORMATIONAL PURPOSES ONLY. SEE IMPORTANT DISCLOSURES AT THE END OF THE PRESENTATION.
Inflation CPI YOY Peak: 9.1% The Consumer Price Index (CPI), has shown signs of stickiness the past six months, averaging about 3.3% since last September. The Fed s preferred inflation metric, Core Personal Consumption Expenditure (excluding food and energy prices), continues decelerating, but is still above the Fed s 2% target level. PCE Core YOY Peak: 5.6% Fed s 2% Target (PCE Core YOY) 14 14 SOURCE: BLOOMBERG FOR INFORMATIONAL PURPOSES ONLY. SEE IMPORTANT DISCLOSURES AT THE END OF THE PRESENTATION.
Fed Funds The Fed is projecting 3 cuts of 25 basis points by Dec 2024. The Fed Funds futures market is also expecting about 3 cuts this year. However, the futures market was projecting about 7 cuts back in January 2024. The futures market is currently expecting the first cut to occur at the July 31, 2024 meeting. 15 15 SOURCE: BLOOMBERG AS OF 4/10/24 FOR INFORMATIONAL PURPOSES ONLY. SEE IMPORTANT DISCLOSURES AT THE END OF THE PRESENTATION.
Year-End Treasury Yields Green is good! Red is bad! Short-term interest rates are at the highest levels since 2000. 3 Month Intermediate and long- term rates are near their highest levels since 2007. 5 Year After many years of extremely low rates, public fund investors are enjoying more normal average interest rates. 16 16 SOURCE: BLOOMBERG AS OF 4/10/24 FOR INFORMATIONAL PURPOSES ONLY. SEE IMPORTANT DISCLOSURES AT THE END OF THE PRESENTATION.
Interest Rates 4.96% 10/19/23 Short-term rates, such as the 3-month treasury, generally have a high correlation to the Fed Funds rate. Breaking Above Recent ~50 BP Range Intermediate and longer-term rates are generally much more correlated to growth and inflation expectations. Bank Failures With growth (GDP) estimates slowing this year and inflation declining materially from the summer 2022 highs, intermediate and longer-term rates have dropped from last fall s peaks, but have increased with recent job and inflation data. It s Been Like Watching Paint Dry For Short-Term Rates 17 17 SOURCE: BLOOMBERG FOR INFORMATIONAL PURPOSES ONLY. SEE IMPORTANT DISCLOSURES AT THE END OF THE PRESENTATION.
19 19
20 20
21 21
22 22
23 23
24 24
Disclosures Meeder Public Funds Meeder Public Funds, Inc. is a registered investment adviser with the Securities and Exchange Commission (SEC) under the Investment Advisers Act of 1940. Registration with the SEC does not imply a certain level of skill or training. The opinions expressed in this presentation are those of Meeder Public Funds, Inc. The material presented has been derived from sources considered to be reliable, but the accuracy and completeness cannot be guaranteed. 6125 Memorial Drive Dublin, OH 43017 901 Mopac Expressway South, Building 1, Suite 300, Austin, Texas 78746 Past performance does not guarantee future results. Opinions and forecasts are all subject to change at any time, based on market and other conditions, and should not be construed as a recommendation of any specific security. Investing in securities involves inherent risks, including the risk that you can lose the value of your investment. Any forecast, projection, or prediction of the market, the economy, economic trends, and fixed- income markets are based upon current opinion as of the date of issue and are also subject to change. Opinions and data presented are not necessarily indicative of future events or expected performance. Meeder Public Funds, Inc. cannot and does not claim to be able to accurately predict the future investment performance of any individual security or of any asset class. There is no assurance that the investment process will consistently lead to successful results. The investment return and principal value of an investment will fluctuate, thus an investor s shares, or units, when redeemed, may be worth more or less than their original cost. 120 North Washington Square, Suite 300, Lansing, Michigan, 48933 111 West Ocean Blvd., 4th Floor Long Beach, CA 90802 222 Main Street, 5th Floor, Salt Lake City, UT 84101 10655 Park Run Drive, Suite 120, Las Vegas, NV 89144 meederpublicfunds.com 866.633.3371 25
