WASBO New School Financial Conference Overview
Revenue Limit,
State General Aid,
and Tax Levy
WASBO New School Administrator & Support Staff Conference
WASBO New School Administrator & Support Staff Conference
6
6
September 2023
September 2023
Mark Elworthy, Director
School Financial Services Team
Ben Kopitzke, Finance Consultant
School Financial Services Team
Agenda
Agenda
Basic Formula
Revenue Limits
Property Tax Levy
State Aids
Questions
Revenue Limits, School Aids,
Revenue Limits, School Aids,
and Property Tax Levies
and Property Tax Levies
Revenue Limit History and Overview
Revenue Limit History and Overview
Revenue limits:
Implemented in 1993-94.
Designed to restrict the amount of revenue a school district can raise through
local property taxes and state general school aids annually on a per pupil basis.
Do not include state categorical aids, federal aids, local receipts, and most
debt service tax levies.
Set to annually increase by $325 per member for foreseeable future.
Calculated based upon a school district’s three-year rolling membership
average. Not dependent on changes in other districts.
Allow for multiple adjustments for certain purposes.
Can be exceeded if approved through local referendum.
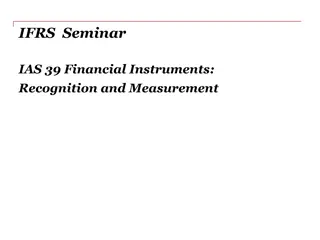
CONTROLLED
Although the mix of aid
and taxes is different
across districts, the
Revenue Limit can control
70-90% of the General
Fund budget!
^ State General Aids includes: equalization aid, special adjustment aid, inter-district & intra-district
aids, and high poverty aid (i.e., state aids received under the districts’ revenue limit caps).
* Other Sources include: state categorical aids, federal aid, and non-property tax local revenue
(i.e., revenue received outside of the districts’ revenue limit caps).
State Totals - School District Revenues
State Totals - School District Revenues
Regulates Revenues for Funds 10, 38 and 41
General Fund (10)
Property Tax Levy
General State Aid
Computer Aid
Non-Referendum Debt Service Fund (38)
Property Tax Levy
Capital Projects Fund (41)
Property Tax Levy
What is within Revenue Limits?
What is within Revenue Limits?
Categorical Aids (Special Education, Per Pupil Aid, Library,
Transportation, SAGE/AGR, Sparsity, etc.)
State and Federal Grants
Student Fees, Gate Receipts, and Donations
Tax Levy for Referendum Approved Debt Service Fund (39)
Tax Levy for Community Service Fund (80)
What is outside the Revenue Limit?
What is outside the Revenue Limit?
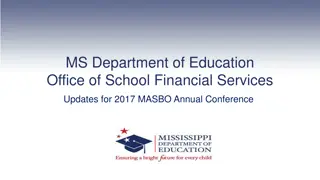
RL: Per Pupil Adjustment History
RL: Per Pupil Adjustment History
* Under the 2011-13 budget act, the per pupil
adjustment in 2011-12 was set at a 5.5% reduction,
The statewide average reduction was $554 per
pupil.
Revenue Limits
Revenue Limits
Membership
September Pupil Count FTE + 40% Summer School FTE (3YRA)
Four-Step Process
Step 1: Build the Base Revenue Per Member
(Worksheet lines 1-3)
Step 2: Calculate New Revenue Per Member
(Worksheet lines 4-7)
Step 3: Determine Allowable Exemptions
(Worksheet lines 8-11)
Step 4: Determine Levy
(Worksheet lines 13-16)
The revenue limit does not include all revenues and it is not a spending
limit.
Revenue Limits & Budget-Building
Revenue Limits & Budget-Building
Watch Change Across Time – Line 11
Watch Change Across Time – Line 11
Total Revenue
Limit with
Exemptions
Year 1
Year 2
Year 3
Line 11 represents the total amount of resource your district will get from
property tax, state general aids, and exempt computer aid. This will equal
about 85-95% of general fund revenues.
For budgeting purposes, it’s
very
important to compare Line 11 with the
previous year’s Line 11. Major decreases in Line 11 from year to year can
have serious implications for your budget. Watch for exemptions.
Total Revenue
Limit with
Exemptions
Total Revenue Limit
with Exemptions
Know the Difference!
Know the Difference!
Recurring Exemptions –
Permanently in Your Base
Base
Non-Recurring Exemptions –
One Year Only
Recurring
This Year
Next Year
Base
Base
Non-Recurring
Base
This Year
Next Year
Line 8
Line 10
Revenue Limit Takeaways
Revenue Limit Takeaways
The Revenue Limit controls revenue from general state aid (including high
poverty aid) and most of your local property tax revenues.
Revenue Limits are calculated by multiplying the three-year rolling
membership average times a per member dollar amount – and adding on
any exemptions.
Most districts are not restrained by their initial calculation but are eligible
for various exemptions to increase their Revenue Limit. Exemptions
result
in additional taxation authority.
Know the difference between recurring and non-recurring exemptions,
especially when planning a referendum.
Calculating the property tax levy is a direct result of completing the
Revenue Limit calculation.
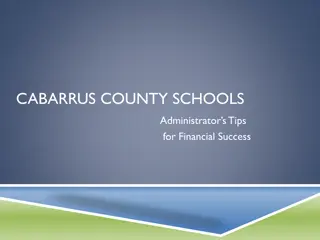
Setting the Levy
Setting the Levy
Page 2 of the Revenue
Limit Worksheet
Line 11 – Total Revenue Limit
(minus)
Line 12 – State General Aid
(equals)
Line 13 – Allowable Limited Tax Levy
The Basic Formula
The Basic Formula
State Aid for Exempt Computer Property
State Aid for Exempt Computer Property
Line 12C
State aid from the Department of Revenue.
Replaces the tax revenue the District would have received if this
property was still included on the taxable rolls.
Calculation was changed as part of the 2017-19 Biennial Budget.
Available around October 15
th
and paid directly by DOR
Levy by Fund
The Line 13 Maximum Levy Amount only applies to three funds.
Fund 10 – General Fund
Fund 38 – Non-Referendum Debt Service
Fund 41 – Capitol Projects Sinking Fund
On Line 14, you allocate your Line 13 amount among these three funds.
The Basic Formula
The Basic Formula
Line 14 CANNOT exceed Line 13.
If it does, the worksheet will let you know.
Avoid the Over-Levy
Avoid the Over-Levy
Line 15 adds tax levies for funds outside the Revenue Limit:
Fund 39 (and other non-Fund 38 funds) – Referendum Approved Debt Service
Fund 80 – Community Services Fund
Prior Year Levy Chargeback for Uncollectible Taxes (in Fund 10)
Designed to recover costs related to approved revenues from prior years.
These amounts are added to Line 14 to determine the gross total levy.
The Basic Formula
The Basic Formula
What funds are regulated by the revenue limit?
Funds 10, 38, and 41
Funds 39, 80, and the prior year levy chargeback for
uncollectible taxes are
outside
the revenue limit.
Revenue Limits
Revenue Limits
POP QUIZ !
POP QUIZ !
Gross Total Levy
Gross Total Levy
The amounts on Line 15 are added to Line 14
to determine the gross total levy on Line 16.
Revenue Limits
Revenue Limits
How can I predict future limits?
SFS Home
(https://dpi.wi.gov/sfs)
Revenue
Limits
Overview
Revenue Limit Worksheets for
Budget Planning
2023-24 Pre-Populated Revenue
Limit Worksheet
The
fundamental
purpose of the Equalization Aid
formula is to “level the playing field” by providing
assistance (distributing aid) to poorer districts
(those with lower property value) to make up for
what they can’t get from their property tax base.
State General Aids
State General Aids
Aid is inversely related to district property value per member.
One pot of money is split over 421 school districts based on district
values, membership, and shared costs. Changes in individual district
data affect every other district’s aid.
Depending on district value-per-member, some districts’ aid is
increased by increasing expenses, while others’ aid is decreased by
increasing expenses.
Know where your district is in the formula and be aware of what is
happening to your district over time.
Basic Equalization Aid Concepts
Basic Equalization Aid Concepts
District Factors (Prior Year Audited)
Shared cost
Membership (Average of 3
rd
Friday in Sept + 2
nd
Friday in January
FTE, plus 100% of Summer FTE, plus other adjustments)
Equalized property value
State Factors
Cost ceilings
Guaranteed valuations per member
Amount of funding the State puts into the formula
What affects the amount of a district’s Equalization Aid?
Equalization Aid Factors
Equalization Aid Factors
The aid computation is actually
three
individual computations…
The results of all three are summed to get the district’s total Equalization Aid
How Equalized Aid Works
How Equalized Aid Works
How the Formula “Works in Theory”
How the Formula “Works in Theory”
2022-23 Property Wealth Data
Highest Property Value District
North Lakeland: $17,506,625 per pupil
Equalization aid: $0 per pupil
Lowest Property Value District
*
Abbotsford: $308,910 per pupil
Equalization aid: $9,570 per pupil
Statewide Average
$861,630 per pupil
Equalization aid: $6,307 per pupil
2023-24 General Equalization Aid Data
2023-24 General Equalization Aid Data
(From July 1
(From July 1
st
st
Aid Estimate)
Aid Estimate)
2022-23 Shared Cost Data
Highest Overall District
Phelps: $29,318 per pupil
Lowest Overall Districts
7 districts ≤ $8,204 per pupil
Statewide Average
$12,455 per pupil
*
Excluding Norris
How The Formula Works
How The Formula Works
Shared Cost is
divided into 3 tiers
by the Cost Ceilings
Secondary Ceiling
Primary Ceiling
How The Formula Works
How The Formula Works
A percentage of shared
cost aided is calculated
for each tier
How The Formula Works
How The Formula Works
$10 million
Not to
perfect
scale
But What About Negative Aid?
But What About Negative Aid?
$5 million
Not to
perfect
scale
District 1
District 2
Shared Cost
$ 13,000
$ 13,000
Equalized Property
$ 400,000
$ 1,000,000
Equalization Aid
Primary
$ 800
$ 500
Secondary
$ 8,000
$ 5,000
Tertiary
$ 1,000
$ -500
Total
$ 9,800
$ 5,000
75%
38%
Sample District Values Per Member
Equalization Aid
Equalization Aid
Percent of total shared
cost – not each
additional dollar of cost
Equalization Aid
Equalization Aid
How can I find out where my district is in the aid formula?
SFS Home
(https://dpi.wi.gov/sfs)
State and Federal Aid
General Aid
Equalization Aid
Percentage Method or Aid Formula Position Excel files
https://dpi.wi.gov/sfs/aid/general/equalization/overview
What happens when a district’s value per member
exceeds the guaranteed value per member?
NEGATIVE AID
154 districts are negatively aided at the tertiary
level because their property value per member is
greater than the tertiary guarantee.
Equalization Aid
Equalization Aid
POP QUIZ !
POP QUIZ !
From Gross Aid Eligibility
From Gross Aid Eligibility
to Actual Aid Payment (I5)
to Actual Aid Payment (I5)
Reductions/adjustments to general aid eligibility
(Lines H1 & I1 on Aid Certification)
1.
Special adjustment (“hold harmless”) aid
ensures a district gets at
least 85% of their aid eligibility from the previous year.
2.
Prior Year (“October to June”) adjustment
: the difference in
general aid amounts calculated between the October 15
th
aid
certification and the final aid run of the prior year (+ or – value).
3.
Private School Vouchers (Statewide, Milwaukee, Racine & SNSP)
:
reduction in aid to offset the cost of the program.
Watch Value Per Member Over Time
Watch Value Per Member Over Time
Alma
West Allis
Equalization Aid Recap
Equalization Aid Recap
One pot of money is split over 421 school districts based on district
membership, shared costs and values; changes in individual district
data affect every other district’s aid.
October 15
th
!
Aid Membership =
Average of 3
rd
Friday in Sept + 2
nd
Friday in
January FTE, plus 100% of Summer FTE, plus other
adjustments
This differs from Revenue Limit Membership.
Depending on district value per member, some districts increase
their aid by increasing expenses, while others decrease their aid by
increasing expenses (negative vs. positive tertiary aid).
Equalization Aid Recap
Equalization Aid Recap
Special Adjustment Aid ensures that districts receive at least
85% of the [gross] general aid eligibility the prior year.
Reductions for the Private Voucher Schools (Statewide,
Milwaukee, Racine and Special Needs Scholarship (SNSP))
impact the actual aid received by the district.
Prior year aid adjustments impact the actual aid payment.
Be aware of what is happening to your district over time…
Questions?
Questions?
DPI School Financial Services Team
https://dpi.wi.gov/sfs
Mark Elworthy, Director
608-266-9534
Ben Kopitzke, Finance Consultant
608-267-9279
This overview covers key topics from the WASBO New School Administrator & Support Staff Conference, including revenue limits, state aids, property tax levies, and the history of revenue limits. Explore the breakdown of school district revenues, what is included within revenue limits, and what falls outside the limits in terms of funding sources.

Download Presentation

Please find below an Image/Link to download the presentation.
The content on the website is provided AS IS for your information and personal use only. It may not be sold, licensed, or shared on other websites without obtaining consent from the author.If you encounter any issues during the download, it is possible that the publisher has removed the file from their server.
You are allowed to download the files provided on this website for personal or commercial use, subject to the condition that they are used lawfully. All files are the property of their respective owners.
The content on the website is provided AS IS for your information and personal use only. It may not be sold, licensed, or shared on other websites without obtaining consent from the author.
E N D
Presentation Transcript
WASBO New School Administrator & Support Staff Conference 6 September 2023 Revenue Limit, State General Aid, and Tax Levy Mark Elworthy, Director School Financial Services Team Ben Kopitzke, Finance Consultant School Financial Services Team
Agenda Basic Formula Revenue Limits Property Tax Levy State Aids Questions 2/40
Revenue Limits, School Aids, and Property Tax Levies State Aid (General + High Poverty + Computer + Exempt Personal Property) Revenue Limit Property TaxLevy 3/40
Revenue Limit History and Overview Revenue limits: Implemented in 1993-94. Designed to restrict the amount of revenue a school district can raise through local property taxes and state general school aids annually on a per pupil basis. Do not include state categorical aids, federal aids, local receipts, and most debt service tax levies. Set to annually increase by $325 per member for foreseeable future. Calculated based upon a school district s three-year rolling membership average. Not dependent on changes in other districts. Allow for multiple adjustments for certain purposes. Can be exceeded if approved through local referendum. 4/40
State Totals - School District Revenues CONTROLLED Although the mix of aid and taxes is different across districts, the Revenue Limit can control 70-90% of the General Fund budget! Other Sources* 22% State General Aids^ 37% Local Property Taxes 41% ^ State General Aids includes: equalization aid, special adjustment aid, inter-district & intra-district aids, and high poverty aid (i.e., state aids received under the districts revenue limit caps). * Other Sources include: state categorical aids, federal aid, and non-property tax local revenue (i.e., revenue received outside of the districts revenue limit caps). 5/40
What is within Revenue Limits? Regulates Revenues for Funds 10, 38 and 41 General Fund (10) Property Tax Levy General State Aid Computer Aid Non-Referendum Debt Service Fund (38) Property Tax Levy Capital Projects Fund (41) Property Tax Levy 6/40
What is outside the Revenue Limit? Categorical Aids (Special Education, Per Pupil Aid, Library, Transportation, SAGE/AGR, Sparsity, etc.) State and Federal Grants Student Fees, Gate Receipts, and Donations Tax Levy for Referendum Approved Debt Service Fund (39) Tax Levy for Community Service Fund (80) 7/40
RL: Per Pupil Adjustment History $275 $300 $257 $241 $325 $230 $220 $209 $206 $200 $194 $179 $175 $200 $75 $100 $50 $0 $0 $- $(100) $(200) $(300) * Under the 2011-13 budget act, the per pupil adjustment in 2011-12 was set at a 5.5% reduction, The statewide average reduction was $554 per pupil. $(400) $(500) $(554) $(600) 8/40
Revenue Limits Membership September Pupil Count FTE + 40% Summer School FTE (3YRA) Four-Step Process Step 1: Build the Base Revenue Per Member (Worksheet lines 1-3) Step 2: Calculate New Revenue Per Member (Worksheet lines 4-7) Step 3: Determine Allowable Exemptions (Worksheet lines 8-11) Step 4: Determine Levy (Worksheet lines 13-16) The revenue limit does not include all revenues and it is not a spending limit. 9/40
DISTRICT: 2022-2023 Revenue Limit Worksheet 1. 2022-23 Base Revenue (Funds 10, 38, 41) 2. Base Sept Membership Avg (2019+.4ss, 2020+.4ss, 2021+.4ss)/3 8,122,339 3. 2022-23 Base Revenue Per Member (Ln 1 / Ln 2) 0 4. 2022-23 Per Member Change (A+B) 459 2022-23 Low Revenue Ceiling per s.121.905(1): 41,772 A. Allowed Per-Member Change for 22-23 3,545,926 B. Low Rev Incr ((Low Rev Ceiling-(3+4A))-4C) NOT<0 317,219 C. Value of the CCDEB (22-23 DPI Computed-CCDEB Dists only) 0 5. 2022-23 Maximum Revenue / Member (Ln 3 + Ln 4) 0 6. Current Membership Avg (2020+.4ss, 2021+.4ss, 2022+.4ss)/3 1,542,952 7. 2022-23 Rev Limit, No Exemptions (Ln 7A + Ln 7B) 10,484,763 A. Max Rev/Memb x Cur Memb Avg (Ln 5 x Ln 6) B. Hold Harmless Non-Recurring Exemption 8. Total 2022-23 Recurring Exemptions (A+B+C+D+E) A. Prior Year Carryover B. Transfer of Service C. Transfer of Territory/Other Reorg (if negative, include sign) D. Federal Impact Aid Loss (2020-21 to 2021-22) E. Recurring Referenda to Exceed (If 2022-23 is first year) 9. 2022-23 Limit with Recurring Exemptions (Ln 7 + Ln 8) 10. Total 2022-23 Non-Recurring Exemptions (A+B+C+D+E+F+G+H+I) 969 A. Non-Recurring Referenda to Exceed 2022-23 Limit B. Declining Enrollment Exemption for 2022-23 (from left) C. Energy Efficiency Net Exemption for 2022-23 (see pg 4 for details) D. Adjustment for Refunded or Rescinded Taxes, 2022-23 E. Prior Year Open Enrollment (uncounted pupil[s]) F. Reduction for Ineligible Fund 80 Expenditures (enter as negative) G. Other Adjustments (Fund 39 Bal Transfer) H. WPCP and RPCP Private School Voucher Aid Deduction I. SNSP Private School Voucher Aid Deduction 11. 2022-23 Revenue Limit With All Exemptions (Ln 9 + Ln 10) 944 12. Total Aid to be Used in Computation (12A + 12B + 12C + 12D) A. 2022-23 OCT 15 CERT OF GENERAL AID B. State Aid to High Poverty Districts (not all districts) C. State Aid for Exempt Computers (Source 691) D. State Aid for Exempt Personal Property (Source 691) average used for Per Pupil Aid does not include "New ICS - Independent Charter Schools FTE." The PPA average appears below after data is entered for 2022: (from left) (from left) (with cents) 10,484,763 FINAL DATA AS OF 6/6/2023 4:30 PM Line 1 Amount May Not Exceed (Line 11 - (Line 7B+Line 10)) of Final 21-22 Revenue Limit 969 2021-22 General Aid Certification (21-22 Line 12A, src 621) 2021-22 Hi Pov Aid (21-22 Line 12B, Src 628) 2021-22 Computer Aid Received (21-22 Line 12C, Src 691) 2021-22 Aid for Exempt Personal Property (21-22 Line 12D, Src 691) 2021-22 Fnd 10 Levy Cert (21-22 Line 14A, Levy 10 Src 211) 2021-22 Fnd 38 Levy Cert (21-22 Line 14B, Levy 38 Src 211) 2021-22 Fnd 41 Levy Cert (21-22 Line 14C, Levy 41 Src 211) 2021-22 Aid Penalty for Over Levy (21-22 FINAL Rev Lim, June 2022) 2021-22 Total Levy for All Levied Non-Recurring Exemptions* NET 2022-23 Base Revenue Built from 2021-22 Data (Line 1) + + + + + + + - - = 10,820.19 0.00 10,000.00 0.00 0.00 0.00 10,820.19 (from left) (rounded) 10,214,259 270,504 (rounded) 944 10,484,763 *For the Non-Recurring Exemptions Levy Amount, enter actual amount for which district levied; (7B Hold Harmless, Non- Recurring Referenda, Declining Enrollment, Energy Efficiency Exemption, Refunded/Rescinded Taxes, Prior Year Open Enrollment Pupils, Reduction for Ineligible Fund 80 Expends, Other Adjustments, Private School Voucher Aid Deduction, Private School Special Needs Voucher Aid Deduction) 983,602 0 8,602 0 0 975,000 September & Summer FTE Membership Averages Count Ch. 220 Inter-District Resident Transfer Pupils @ 75%. 11,468,365 2,679,559 Line 2: Base Avg:((19+.4ss)+(20+.4ss)+(21+.4ss)) / 3 = 975,000 270,505 1,103,418 2019 59 24 971 0.00 2020 63 25 941 0.00 2021 71 28 918 0.00 Summer FTE: % (40,40,40) Sept FTE: New ICS - Independent Charter Schools FTE 0 63,020 0 0 Total FTE 995 966 946 228,388 39,228 14,147,924 7,951,826 Line 6: Curr Avg:((20+.4ss)+(21+.4ss)+(22+.4ss)) / 3 = 7,927,777 2020 63 25 941 0.00 2021 71 28 918 0.00 2022 63 25 893 3.00 Summer FTE: % (40,40,40) Sept FTE: New ICS - Independent Charter Schools FTE 0 The Line 6 "Current Average" shown above is used for Revenue Limits. The 459 23,590 DISTRICTS MUST USE THE OCT 15 AID CERT WHEN SETTING THE DISTRICT LEVY. 13. Allowable Limited Revenue: (Line 11 - Line 12) (10, 38, 41 Levies) 14. Total Limited Revenue To Be Used (A+B+C) Entries Required Below: Enter amnts needed by purpose and fund: A. Gen Operations: Fnd 10 Src 211 B. Non-Referendum Debt (inside limit) Fund 38 Src 211 C. Capital Exp, Annual Meeting Approved: Fund 41 Src 211 25 15. Total Revenue from Other Levies (A+B+C+D) 10,820.19 A. Referendum Apprvd Debt (Fund 39 Debt-Src 211) 270,505 B. Community Services (Fund 80 Src 211) C. Prior Year Levy Chargeback for Uncollectible Taxes (Src 212) D. Other Levy Revenue - Milwaukee & Kenosha Only 608,961,541 16. Total Fall, 2022 REPORTED All Fund Tax Levy (14A + 14B + 14C + 15) Line 16 is the total levy to be apportioned in the PI-401. District-Entered Districts are responsible for the integrity of their revenue limit data & computation. Data appearing here reflects information submitted to DPI and is unaudited. 6,196,098 Total FTE 966 946 921 Not >line 13 6,196,098 943 5,143,384 (Proposed Fund 10) 1,052,714 (to Budget Rpt) 0 (to Budget Rpt) Line 10B: Declining Enrollment Exemption = Average FTE Loss (Line 2 - Line 6, if > 0) 270,505 25 X 1.00 10,227 = 0 X (Line 5, Maximum 2022-2023 Revenue per Memb) = Non-Recurring Exemption Amount: 10,000 227 (to Budget Rpt) (to Budget Rpt) (to Budget Rpt) 0 Fall 2022 Property Values 2022 TIF-Out Tax Apportionment Equalized Valuation 6,206,325 Levy Rate = 0.01019165 CELL COLOR KEY: Worksheet is available at: http://dpi.wi.gov/sfs/limits/worksheets/revenue Auto-Calc DPI Data 10/4 Calculation Revised: 8/5/2020. Rounding in Total FTE buckets.
Revenue Limits & Budget-Building Watch Change Across Time Line 11 Year 3 Year 1 Year 2 Total Revenue Limit with Exemptions Total Revenue Limit with Exemptions Total Revenue Limit with Exemptions Line 11 represents the total amount of resource your district will get from property tax, state general aids, and exempt computer aid. This will equal about 85-95% of general fund revenues. For budgeting purposes, it s very important to compare Line 11 with the previous year s Line 11. Major decreases in Line 11 from year to year can have serious implications for your budget. Watch for exemptions. 11/4
Know the Difference! Line 10 Line 8 Non-Recurring Exemptions One Year Only Recurring Exemptions Permanently in Your Base This Year Next Year This Year Next Year Recurring Non-Recurring Base Base Base Base 12/4
Revenue Limit Takeaways The Revenue Limit controls revenue from general state aid (including high poverty aid) and most of your local property tax revenues. Revenue Limits are calculated by multiplying the three-year rolling membership average times a per member dollar amount and adding on any exemptions. Most districts are not restrained by their initial calculation but are eligible for various exemptions to increase their Revenue Limit. Exemptions result in additional taxation authority. Know the difference between recurring and non-recurring exemptions, especially when planning a referendum. Calculating the property tax levy is a direct result of completing the Revenue Limit calculation. 13/4
2022-2023 Revenue Limit Worksheet 1. 2022-23 Base Revenue (Funds 10, 38, 41) 2. Base Sept Membership Avg (2019+.4ss, 2020+.4ss, 2021+.4ss)/3 3. 2022-23 Base Revenue Per Member (Ln 1 / Ln 2) 4. 2022-23 Per Member Change (A+B) 2022-23 Low Revenue Ceiling per s.121.905(1): A. Allowed Per-Member Change for 22-23 B. Low Rev Incr ((Low Rev Ceiling-(3+4A))-4C) NOT<0 C. Value of the CCDEB (22-23 DPI Computed-CCDEB Dists only) 5. 2022-23 Maximum Revenue / Member (Ln 3 + Ln 4) 6. Current Membership Avg (2020+.4ss, 2021+.4ss, 2022+.4ss)/3 7. 2022-23 Rev Limit, No Exemptions (Ln 7A + Ln 7B) A. Max Rev/Memb x Cur Memb Avg (Ln 5 x Ln 6) B. Hold Harmless Non-Recurring Exemption 8. Total 2022-23 Recurring Exemptions (A+B+C+D+E) A. Prior Year Carryover B. Transfer of Service C. Transfer of Territory/Other Reorg (if negative, include sign) D. Federal Impact Aid Loss (2020-21 to 2021-22) E. Recurring Referenda to Exceed (If 2022-23 is first year) 9. 2022-23 Limit with Recurring Exemptions (Ln 7 + Ln 8) 10. Total 2022-23 Non-Recurring Exemptions (A+B+C+D+E+F+G+H+I) A. Non-Recurring Referenda to Exceed 2022-23 Limit B. Declining Enrollment Exemption for 2022-23 (from left) C. Energy Efficiency Net Exemption for 2022-23 (see pg 4 for details) D. Adjustment for Refunded or Rescinded Taxes, 2022-23 E. Prior Year Open Enrollment (uncounted pupil[s]) F. Reduction for Ineligible Fund 80 Expenditures (enter as negative) G. Other Adjustments (Fund 39 Bal Transfer) H. WPCP and RPCP Private School Voucher Aid Deduction I. SNSP Private School Voucher Aid Deduction 11. 2022-23 Revenue Limit With All Exemptions (Ln 9 + Ln 10) 12. Total Aid to be Used in Computation (12A + 12B + 12C + 12D) A. 2022-23 OCT 15 CERT OF GENERAL AID B. State Aid to High Poverty Districts (not all districts) C. State Aid for Exempt Computers (Source 691) D. State Aid for Exempt Personal Property (Source 691) DISTRICTS MUST USE THE OCT 15 AID CERT WHEN SETTING THE DISTRICT LEVY. (from left) (from left) (with cents) 10,484,763 Setting the Levy 969 10,820.19 0.00 10,000.00 0.00 0.00 0.00 10,820.19 (from left) (rounded) 10,214,259 270,504 (rounded) 944 10,484,763 983,602 0 8,602 0 0 975,000 11,468,365 2,679,559 975,000 270,505 1,103,418 Page 2 of the Revenue Limit Worksheet 0 63,020 0 0 228,388 39,228 14,147,924 7,951,826 7,927,777 0 459 23,590 13. Allowable Limited Revenue: (Line 11 - Line 12) (10, 38, 41 Levies) 14. Total Limited Revenue To Be Used (A+B+C) Entries Required Below: Enter amnts needed by purpose and fund: A. Gen Operations: Fnd 10 Src 211 B. Non-Referendum Debt (inside limit) Fund 38 Src 211 C. Capital Exp, Annual Meeting Approved: Fund 41 Src 211 15. Total Revenue from Other Levies (A+B+C+D) A. Referendum Apprvd Debt (Fund 39 Debt-Src 211) B. Community Services (Fund 80 Src 211) C. Prior Year Levy Chargeback for Uncollectible Taxes (Src 212) D. Other Levy Revenue - Milwaukee & Kenosha Only 16. Total Fall, 2022 REPORTED All Fund Tax Levy (14A + 14B + 14C + 15) Line 16 is the total levy to be apportioned in the PI-401. 6,196,098 Not >line 13 6,196,098 5,143,384 (Proposed Fund 10) 1,052,714 (to Budget Rpt) 0 (to Budget Rpt) 10,227 0 10,000 227 (to Budget Rpt) (to Budget Rpt) (to Budget Rpt) 0 6,206,325 Levy Rate = 0.01019165 Districts are responsible for the integrity of their revenue limit data & computation. Data appearing here reflects information submitted to DPI and is unaudited. 14/4
The Basic Formula Line 11 Total Revenue Limit (minus) Line 12 State General Aid (equals) Line 13 Allowable Limited Tax Levy 11. 2022-23 Revenue Limit With All Exemptions (Ln 9 + Ln 10) 12. Total Aid to be Used in Computation (12A + 12B + 12C + 12D) A. 2022-23 OCT 15 CERT OF GENERAL AID B. State Aid to High Poverty Districts (not all districts) C. State Aid for Exempt Computers (Source 691) D. State Aid for Exempt Personal Property (Source 691) DISTRICTS MUST USE THE OCT 15 AID CERT WHEN SETTING THE DISTRICT LEVY. 14,147,924 7,951,826 7,927,777 0 459 23,590 13. Allowable Limited Revenue: (Line 11 - Line 12) (10, 38, 41 Levies) 6,196,098 15/4
State Aid for Exempt Computer Property Line 12C State aid from the Department of Revenue. Replaces the tax revenue the District would have received if this property was still included on the taxable rolls. Calculation was changed as part of the 2017-19 Biennial Budget. Available around October 15th and paid directly by DOR 16/4
The Basic Formula Levy by Fund The Line 13 Maximum Levy Amount only applies to three funds. Fund 10 General Fund Fund 38 Non-Referendum Debt Service Fund 41 Capitol Projects Sinking Fund On Line 14, you allocate your Line 13 amount among these three funds. 13. Allowable Limited Revenue: (Line 11 - Line 12) (10, 38, 41 Levies) 14. Total Limited Revenue To Be Used (A+B+C) Entries Required Below: Enter amnts needed by purpose and fund: A. Gen Operations: Fnd 10 Src 211 B. Non-Referendum Debt (inside limit) Fund 38 Src 211 C. Capital Exp, Annual Meeting Approved: Fund 41 Src 211 6,196,098 Not >line 13 6,196,098 5,143,384 (Proposed Fund 10) 1,052,714 (to Budget Rpt) 0 (to Budget Rpt) 17/4
Avoid the Over-Levy Line 14 CANNOT exceed Line 13. If it does, the worksheet will let you know. 13. Allowable Limited Revenue: (Line 11 - Line 12) (10, 38, 41 Levies) 14. Total Limited Revenue To Be Used (A+B+C) Entries Required Below: Enter amnts needed by purpose and fund: A. Gen Operations: Fnd 10 Src 211 B. Non-Referendum Debt (inside limit) Fund 38 Src 211 C. Capital Exp, Annual Meeting Approved: Fund 41 Src 211 6,196,098 EXCEEDS LIMIT !! Not >line 13 6,302,714 5,250,000 (Proposed Fund 10) 1,052,714 (to Budget Rpt) 0 (to Budget Rpt) 18/4
The Basic Formula Line 15 adds tax levies for funds outside the Revenue Limit: Fund 39 (and other non-Fund 38 funds) Referendum Approved Debt Service Fund 80 Community Services Fund Prior Year Levy Chargeback for Uncollectible Taxes (in Fund 10) Designed to recover costs related to approved revenues from prior years. 10,227 15. Total Revenue from Other Levies (A+B+C+D) A. Referendum Apprvd Debt (Fund 39 Debt-Src 211) B. Community Services (Fund 80 Src 211) C. Prior Year Levy Chargeback for Uncollectible Taxes (Src 212) D. Other Levy Revenue - Milwaukee & Kenosha Only 16. Total Fall, 2022 REPORTED All Fund Tax Levy (14A + 14B + 14C + 15) Line 16 is the total levy to be apportioned in the PI-401. 0 10,000 227 (to Budget Rpt) (to Budget Rpt) (to Budget Rpt) 0 6,206,325 Levy Rate = 0.01019165 These amounts are added to Line 14 to determine the gross total levy. 19/4
Revenue Limits POP QUIZ ! What funds are regulated by the revenue limit? Funds 10, 38, and 41 Funds 39, 80, and the prior year levy chargeback for uncollectible taxes are outside the revenue limit. 20/4
Gross Total Levy The amounts on Line 15 are added to Line 14 to determine the gross total levy on Line 16. 13. Allowable Limited Revenue: (Line 11 - Line 12) (10, 38, 41 Levies) 14. Total Limited Revenue To Be Used (A+B+C) Entries Required Below: Enter amnts needed by purpose and fund: A. Gen Operations: Fnd 10 Src 211 B. Non-Referendum Debt (inside limit) Fund 38 Src 211 C. Capital Exp, Annual Meeting Approved: Fund 41 Src 211 15. Total Revenue from Other Levies (A+B+C+D) A. Referendum Apprvd Debt (Fund 39 Debt-Src 211) B. Community Services (Fund 80 Src 211) C. Prior Year Levy Chargeback for Uncollectible Taxes (Src 212) D. Other Levy Revenue - Milwaukee & Kenosha Only 16. Total Fall, 2022 REPORTED All Fund Tax Levy (14A + 14B + 14C + 15) Line 16 is the total levy to be apportioned in the PI-401. 6,196,098 Not >line 13 6,196,098 5,143,384 (Proposed Fund 10) 1,052,714 (to Budget Rpt) 0 (to Budget Rpt) 10,227 0 10,000 227 (to Budget Rpt) (to Budget Rpt) (to Budget Rpt) 0 6,206,325 Levy Rate = 0.01019165 21/4
Revenue Limits How can I predict future limits? SFS Home (https://dpi.wi.gov/sfs) Revenue Limits Overview Revenue Limit Worksheets for Budget Planning 2023-24 Pre-Populated Revenue Limit Worksheet 22/4
State General Aids The fundamental purpose of the Equalization Aid formula is to level the playing field by providing assistance (distributing aid) to poorer districts (those with lower property value) to make up for what they can t get from their property tax base. 23/4
Basic Equalization Aid Concepts Aid is inversely related to district property value per member. One pot of money is split over 421 school districts based on district values, membership, and shared costs. Changes in individual district data affect every other district s aid. Depending on district value-per-member, some districts aid is increased by increasing expenses, while others aid is decreased by increasing expenses. Know where your district is in the formula and be aware of what is happening to your district over time. 24/4
Equalization Aid Factors What affects the amount of a district s Equalization Aid? District Factors (Prior Year Audited) Shared cost Membership (Average of 3rd Friday in Sept + 2nd Friday in January FTE, plus 100% of Summer FTE, plus other adjustments) Equalized property value State Factors Cost ceilings Guaranteed valuations per member Amount of funding the State puts into the formula 25/4
How Equalized Aid Works The aid computation is actually three individual computations The results of all three are summed to get the district s total Equalization Aid Primary Tier Secondary Tier Tertiary Tier 26/4
How the Formula Works in Theory Primary Tier & Aid 100% minus ($1,058,573 / $1,930,000) = 45.2% WISCONSIN DEPARTMENT OF PUBLIC INSTRUCTION JULY 1 ESTIMATE OF 2023-24 GENERAL AID USING 2022-23 BUDGET REPORT DATA, 2022-23 AUDITED MEMBERSHIP Primary Aid: 45.2%* $5,753,000 = $2,597,975 2021 TIFOUT SCHOOL AID VALUE (CERT MAY 2022) & 2016 COMPUTER VALUE (CERT MAY 2017) PRIMARY (G1) 1,930,000 5,790,000 2,895,000 SECONDARY (G6) TERTIARY (G11) 2,006,079 861,630 6,018,237 2,584,890 3,009,118 1,292,445 Secondary Tier & Aid 2023-2024 JULY 1 ESTIMATE GENERAL AID PART E: 2022-23 SHARED COST - CONTINUED PRIMARY COST CEILING PER MEMBER PRIMARY CEILING (A7 * E6) PRIMARY SHARED COST (LESSER OF E5 OR E7) SECONDARY COST CEILING PER MEMBER SECONDARY CEILING (A7 * E9) SECONDARY SHARED COST ((LESSER OF E5 OR E10) - E8) TERTIARY SHARED COST (GREATER OF (E5 - E8 - E11) OR 0) E4 = 95,467,094.85 1,000 5,753,000.00 5,753,000.00 11,210 64,491,130.00 58,738,130.00 100% minus ($1,058,573 / $2,006,079) = 47.2% Secondary Aid: 47.2% * $58,738,130 =$27,743,040 30,975,964.85 SHARED COST PER MEMBER = $16,594 Tertiary Tier & Aid PART F: EQUALIZED PROPERTY VALUE 2022 TIFOUT VALUE (CERT MAY 23) + EXEMPT COMPUTER VALUE (CERT MAY 17) 6,089,972,647 VALUE PER MEMBER = 1,058,573 100% minus ($1,058,573 / $861,630) = -22.9% Tertiary Aid: -22.9% * $30,975,965 = -$7,080,185 27/4
2023-24 General Equalization Aid Data (From July 1st Aid Estimate) 2022-23 Property Wealth Data 2022-23 Shared Cost Data Highest Property Value District Highest Overall District North Lakeland: $17,506,625 per pupil Phelps: $29,318 per pupil Equalization aid: $0 per pupil Lowest Property Value District* Lowest Overall Districts 7 districts $8,204 per pupil Abbotsford: $308,910 per pupil Equalization aid: $9,570 per pupil Statewide Average $12,455 per pupil Statewide Average $861,630 per pupil Equalization aid: $6,307 per pupil * Excluding Norris 28/4
How The Formula Works $15,000 $12,500 Secondary Ceiling Shared Cost is $10,000 divided into 3 tiers $7,500 by the Cost Ceilings $5,000 $2,500 Primary Ceiling $0 1,000 members Primary Secondary Tertiary 29/4
How The Formula Works $15,000 A percentage of shared $12,000 cost aided is calculated for each tier $9,000 $6,000 Your Value per Member Guaranteed Value per Member at that tier % Aided = 100% $3,000 $0 1,000 members Primary Secondary Tertiary 30/4
How The Formula Works $15,000 Tertiary Tier $500,000 $861,630 100% = 6% $12,000 $9,000 Secondary Tier $500,000 100% = 54% $2,006,079 $6,000 Not to perfect scale $3,000 Primary Tier $500,000 100% = 74% $1,930,000 $0 1,000 members Primary Secondary Tertiary 31/4
But What About Negative Aid? $15,000 Tertiary Tier $12,000 $1,000,000 100% =-32% $861,630 $9,000 Secondary Tier $1,000,000 $6,000 Not to perfect scale 100% = 36% $2,006,079 $3,000 Primary Tier $1,000,000 100% = 64% $1,930,000 $0 1,000 members Primary Secondary Tertiary 32/4
Equalization Aid Sample District Values Per Member District 1 District 2 Shared Cost $ 13,000 $ 13,000 Equalized Property $ 400,000 $ 1,000,000 Equalization Aid Primary $ 800 $ 500 Secondary $ 8,000 $ 5,000 Tertiary $ 1,000 Total $ 9,800 $ 5,000 75% 38% $ -500 Percent of total shared cost not each additional dollar of cost 33/4
Equalization Aid How can I find out where my district is in the aid formula? SFS Home (https://dpi.wi.gov/sfs) State and Federal Aid General Aid Equalization Aid Percentage Method or Aid Formula Position Excel files https://dpi.wi.gov/sfs/aid/general/equalization/overview 34/4
Equalization Aid POP QUIZ ! What happens when a district s value per member exceeds the guaranteed value per member? NEGATIVE AID 154 districts are negatively aided at the tertiary level because their property value per member is greater than the tertiary guarantee. 35/4
From Gross Aid Eligibility to Actual Aid Payment (I5) Reductions/adjustments to general aid eligibility (Lines H1 & I1 on Aid Certification) 1. Special adjustment ( hold harmless ) aid ensures a district gets at least 85% of their aid eligibility from the previous year. 2. Prior Year ( October to June ) adjustment: the difference in general aid amounts calculated between the October 15th aid certification and the final aid run of the prior year (+ or value). 3. Private School Vouchers (Statewide, Milwaukee, Racine & SNSP): reduction in aid to offset the cost of the program. 36/4
Watch Value Per Member Over Time Alma West Allis 37/4
Equalization Aid Recap One pot of money is split over 421 school districts based on district membership, shared costs and values; changes in individual district data affect every other district s aid. October 15th! Aid Membership = Average of 3rd Friday in Sept + 2nd Friday in January FTE, plus 100% of Summer FTE, plus other adjustments This differs from Revenue Limit Membership. Depending on district value per member, some districts increase their aid by increasing expenses, while others decrease their aid by increasing expenses (negative vs. positive tertiary aid). 38/4
Equalization Aid Recap Special Adjustment Aid ensures that districts receive at least 85% of the [gross] general aid eligibility the prior year. Reductions for the Private Voucher Schools (Statewide, Milwaukee, Racine and Special Needs Scholarship (SNSP)) impact the actual aid received by the district. Prior year aid adjustments impact the actual aid payment. Be aware of what is happening to your district over time 39/4
Questions? DPI School Financial Services Team https://dpi.wi.gov/sfs Mark Elworthy, Director Ben Kopitzke, Finance Consultant 608-266-9534 608-267-9279 40/4