Utilizing Consumer Satisfaction Data for Effective Planning
Explore the significance of measuring consumer satisfaction to evaluate SPIL implementation, effective data gathering and analysis methods, collaboration strategies among SILC, CIL, and DSU for creating annual reports, and insights into Missouri's IL outcomes model and survey history, covering various program services and SPIL objectives.
Download Presentation

Please find below an Image/Link to download the presentation.
The content on the website is provided AS IS for your information and personal use only. It may not be sold, licensed, or shared on other websites without obtaining consent from the author.If you encounter any issues during the download, it is possible that the publisher has removed the file from their server.
You are allowed to download the files provided on this website for personal or commercial use, subject to the condition that they are used lawfully. All files are the property of their respective owners.
The content on the website is provided AS IS for your information and personal use only. It may not be sold, licensed, or shared on other websites without obtaining consent from the author.
E N D
Presentation Transcript
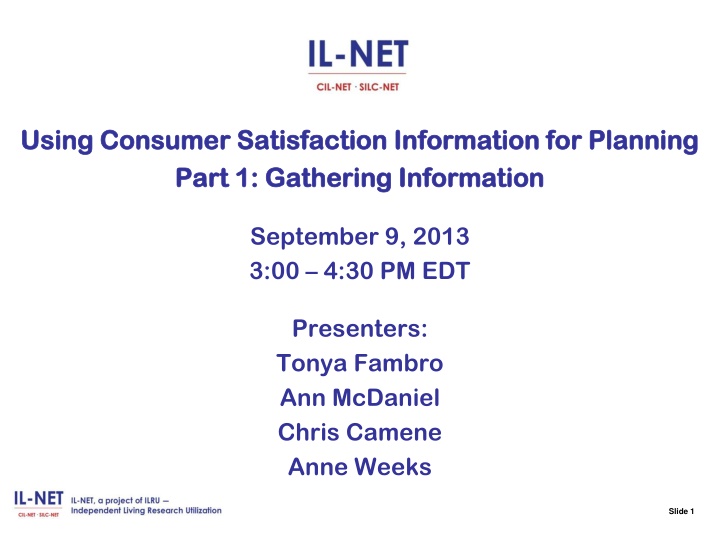
Using Consumer Satisfaction Information for Planning Using Consumer Satisfaction Information for Planning Part Part 1: Gathering Information 1: Gathering Information September 9, 2013 3:00 4:30 PM EDT Presenters: Tonya Fambro Ann McDaniel Chris Camene Anne Weeks Slide 1
Slide 2 You will learn You will learn Slide 2 The importance of regularly measuring consumer satisfaction as one tactic for evaluating SPIL implementation within a State. Effective approaches for gathering, analyzing and interpreting consumer satisfaction data. Strategies for effective collaboration between the SILC, CIL and DSU for creating a statewide annual report that aids in service improvement. Slide 2
Slide 3 Overview of Missouri IL Outcomes model Overview of Missouri IL Outcomes model Slide 3 Presented by: Tonya Fambro, Office of Adult Learning and Rehabilitation Services, Jefferson City, MO Slide 3
Slide 4 History of Missouri IL Outcomes survey History of Missouri IL Outcomes survey Slide 4 Collaborative effort between SILC, DSU, and CILs in 2004 to create survey tool Used same survey for 7 years in order to compare results All 22 CILs participate as requirement for IL Grant Began online tool in 2009 Added follow-up questions on how services positively impacted Current survey includes questions from SPIL Use results for statewide distribution for Needs assessment Legislative update Individual CIL statistics are provided for each CIL s use Slide 4
Slide 5 Missouris IL Outcomes survey Missouri s IL Outcomes survey Slide 5 Covers 15 program services Four core, plus Youth Services including Transition from School to Work or IL Emergency Assistance Services Institutional Diversion or Nursing Home Transition Transportation Training or Referral Benefits Advisement Employment Advisement Home Modification Housing Referral or Assistance Personal Assistance Services (PAS) Technology or Adaptive Equipment Slide 5
Slide 6 Missouris IL Outcomes survey, contd. Missouri s IL Outcomes survey, cont d. Slide 6 Additional questions are asked for fulfilling SPIL objectives: Voting Habits Veteran Status Medicaid Eligibility Emergency Preparedness Slide 6 6
Slide 7 Requirements for IL Outcomes survey Requirements for IL Outcomes survey Slide 7 CILs contact consumers by phone or in person CILs must contact 20% of active IL caseload receiving services in current Federal Fiscal Year Deadline is November 15 of each year in order to have results for next Legislative session Slide 7 7
Slide 8 Sample of Missouri survey tool questions Sample of Missouri survey tool questions Slide 8 Information Questions Are you a United States Veteran? yes no Are you eligible for Missouri Medicaid? yes no Voter Status Are you a registered voter? yes no Slide 8
Slide 9 Sample of Missouri survey tool questions, Sample of Missouri survey tool questions, cont d. cont d. Slide 9 Advocacy Did you receive any advocacy services? yes no Assistance and/or representation in obtaining access to benefits, services, and programs to which a consumer may be entitled. yes no Slide 9
Slide 10 Sample of Missouri survey tool questions, Sample of Missouri survey tool questions, cont d. 2 cont d. 2 Slide 10 Advocacy Follow-up What was your experience with the Advocacy services you received? satisfied somewhat satisfied dissatisfied If you choose somewhat satisfied or dissatisfied, please describe how the Advocacy service could have been better. Slide 10
Slide 11 Sample of Missouri survey tool questions Sample of Missouri survey tool questions, cont d. 3 , cont d. 3 Slide 11 Did you gain knowledge, skill and/or independence from the Advocacy service? yes no Advocacy Change Did this Advocacy service make a positive change in your life? yes no If yes, what change did this Advocacy service make? Slide 11
Slide 12 Statewide Report Statewide Report Slide 12 Posted online Individual CIL statistics sent back for each CIL use 704 Report Demographics used for informational purposes Compared to prior years to find trends Needs assessment Slide 12 12
Slide 13 Statistical Information Statistical Information Slide 13 Total numbers of consumers served in MO-22 CILs Age of consumers served Gender Race & Ethnicity Disability Services requested Services received Goals set to increase independence in SLA Improved access to transportation, Health care, AT Slide 13
Slide 14 Questions and Answers Questions and Answers Slide 14 Slide 14
Slide 15 Missouri Links and Contact Information Missouri Links and Contact Information Slide 15 Tammy McSorley Email: mo.silc@vr.dese.mo.gov Phone: (573) 526-7039 Missouri SILC Webpage http://www.mosilc.org 2012 IL Outcomes Report http://www.mosilc.org/iloutcomes2012.pdf Slide 15
Slide 16 Overview of West Virginia model Overview of West Virginia model Slide 16 Presented by: Ann McDaniel, West Virginia SILC Slide 16 16
Slide 17 The West Virginia Story Includes The West Virginia Story Includes Slide 17 Experience measuring satisfaction of IL consumers Evolution of the process used over time How the data gathered is analyzed How the data is used by the SILC Slide 17 17
Slide 18 History of Efforts in West Virginia History of Efforts in West Virginia Slide 18 DSU, CILs, and SILC all measured satisfaction separately and in different ways First combined effort included SRC and survey was sent to VR clients as well as IL consumers Refined combined effort Includes DSU, CILs, and SILC Surveys go out to all IL consumers from SILC Data compiled and analyzed by outside consultant Statewide report generated and shared Individual CILs receive raw data from their consumers Slide 18 18
Slide 19 How Tool was Developed How Tool was Developed Slide 19 In an effort to eliminate duplication of effort DSU, CILs, and SILC met and developed the tool together Agreement on what data to gather & questions to ask Tool was refined by outside consultant Tool was used for more than 3 years without any revisions to gather valid data over time Tool was then further refined by outside consultant and SILC Process continues to be refined Slide 19 19
Slide 20 Survey Form Survey Form double sided single sheet double sided single sheet Slide 20 Front Front Explains who survey is coming from Explains why you are receiving the survey Requests optional demographics information Includes coding Slide 20
Slide 21 Survey Form Back Survey Form Back Slide 21 Includes Likert scale of 13 items of satisfaction Includes checklist of rights information provided Includes checklist of services received Includes open-ended questions: Did the CIL services help to make your life different? ___ Yes ___ No __ I Don't Know If the services made a difference, please tell us how. What other services would you like the CIL to offer? What could we do better? Slide 21
Slide 22 Refined Process Refined Process Slide 22 Survey tool refined to include data requested by SILC Consultant conducting telephone survey with 50 person random sample evenly distributed by geographic area and by CIL Mail survey sent to remainder of IL consumers Follow-up survey sent to those who have not responded after 2 weeks Slide 22 22
Slide 23 Coding of Surveys Coding of Surveys Slide 23 All Surveys are coded by: CIL Status (open or closed) Program County Surveys are also given a number in order to track who has responded and who needs a follow-up survey Slide 23 23
Slide 24 Incentives to Respond Incentives to Respond Slide 24 Several incentives have been tried over the years: A small calendar card for the year A ruler A tea bag (to have a cup of tea while doing survey) Chance to win an iPod Shuffle/mp3 player Current Incentives: Tea Bag Gift Card Slide 24 24
Slide 25 How Data is Compiled How Data is Compiled Slide 25 Responses are received by SILC All responses are sent, unopened, to outside consultant All responses are compiled by consultant Responses are sorted by CIL and raw data is shared with appropriate CIL Data is Analyzed and a statewide report is prepared Slide 25 25
Slide 26 Coverage by County Coverage by County Slide 26 Surveys were conducted (by phone or mail) with consumers from 38 of the 55 counties in West Virginia. The following table lists the number of surveys sent and returned by county. Report includes data on the number and percentage of responses from each of the six Districts of the DSU Slide 26
Slide 27 Type of Program Type of Program Slide 27 Each of the surveys contained codes for the programs in which consumers participated. 91 people in the Community Living Services Program 29 people in the Title VII-Part C program 6 Family Support participants 5 were in the Employment Services program 3 received Title VII-Part B services 2 people received HUD services. Slide 27
Slide 28 Type of Disability Type of Disability Slide 28 Consumers were asked to indicate their disability: Type of Disability Respondents Percent Motor 53 Other/Various 25 Cardiac/Respiratory 13 Cognitive 12 Sensory 9 Mental Health 5 Total 117 100% 45% 22% 11% 10% 8% 4% Slide 28
Slide 29 Validity of Data Validity of Data Slide 29 Current survey format was developed in 2003-2004, therefore, data for these items has been collected for several program years Response rate was 38% Responses included 50 telephone surveys Surveys provided to all CIL consumers annually Slide 29
Slide 30 Variables Considered Variables Considered Slide 30 Open vs. Closed cases Consumers of different CILs Specific services received Impact of services Slide 30
Slide 31 How is Data Used? How is Data Used? Slide 31 Report is shared with DSU, CILs, & SILC CILs use the data to improve services and in developing work plans SILC & DSU use the data: In SPIL development To identify unmet needs To identify trends Slide 31
Slide 32 Our Plans from Here Our Plans from Here Slide 32 Continue to increase response rate To improve validity of data To provide analysis of data to each CIL Increase usefulness of data In development of SPIL In identifying need for new CILs For CILs to improve services and address unmet needs Slide 32
Slide 33 Questions and Answers Questions and Answers Slide 33 Slide 33
Slide 34 West Virginia Links and Contact Information West Virginia Links and Contact Information Slide 34 Ann McDaniel Email: ann.meadows@wvsilc.org Phone: (304) 766-4624 http://www.wvsilc.org Slide 34 34
Slide 35 Wrap Up and Evaluation Wrap Up and Evaluation Slide 35 Please click the link below to complete your evaluation of this program: https://vovici.com/wsb.dll/s/12291g542c4 Slide 35
Slide 36 SILC SILC- -NET Attribution NET Attribution Support for development of this training was provided by the U.S. Department of Education, Rehabilitation Services Administration under grant number H132B120001. No official endorsement of the Department of Education should be inferred. Permission is granted for duplication of any portion of this PowerPoint presentation, providing that the following credit is given to the project: Developed as part of the SILC-NET, a project of the IL-NET, an ILRU/NCIL/APRIL National Training and Technical Assistance Program. Slide 36 Slide 36
