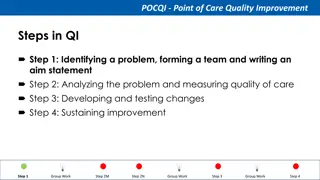
Using Data to Drive Improvement in Education
This content focuses on utilizing data to drive improvement in education, specifically in the context of Fentress County Schools. It includes sessions on data-driven instruction, consensus building, analysis of data, making inferences, and engaging in structured data-driven dialogues. The content emphasizes the importance of interpreting data to derive meaning and improve educational practices.

Download Presentation

Please find below an Image/Link to download the presentation.
The content on the website is provided AS IS for your information and personal use only. It may not be sold, licensed, or shared on other websites without obtaining consent from the author. If you encounter any issues during the download, it is possible that the publisher has removed the file from their server.
You are allowed to download the files provided on this website for personal or commercial use, subject to the condition that they are used lawfully. All files are the property of their respective owners.
The content on the website is provided AS IS for your information and personal use only. It may not be sold, licensed, or shared on other websites without obtaining consent from the author.
E N D
Presentation Transcript
USING DATA TO PROMOTE IMPROVEMENT 1
SESSION OVERVIEW 2 Welcome & Introductions County Context Building the Bridge Between Data and Results Q & A
. FENTRESS COUNTY SCHOOLS 3
. FENTRESS COUNTY SCHOOLS 4 Adapted from: Bernhardt, V., (2006).
WHAT DO YOU PREDICT? 5 Turn and talk to your neighbor. What do you think the data from our group will show?
CONSENSOGRAM 6 1. To what degree do you believe in the need for data-driven instruction? (BLUE) 2. To what extent is this statement true? There is a systematic reliance on hard data performance data, including data for individual students as a basis for instructional decision- making at the classroom and school level in my region. (ORANGE) 3. Where on the scale do you rate your own skills in delivering and supporting data-driven conversations? (PINK) 4. To what degree are data-driven conversations about student performance a norm for teachers and administrators in your school or district? (GREEN)
JUSTTHE FACTS 7 What observations can we make about this data? What do you notice? What jumps out at you?
WHATCANWEINFER? 8 What inferences can you make based on the data? What questions do you have after looking at the data?
3-Phase Data-Driven Dialogue A Structured Process for 9 Phase 1- PREDICT Activating & Engaging Surfacing experiences, possibilities, and expectations Phase 2- OBSERVE Exploring & Discovering Exploring & Discovering Phase 3- INFER Organizing & Integrating Phase 2- OBSERVE Analyzing the data Analyzing the data Generating Possible Explanations Adapted from Laura Lipton and Bruce Wellman
AN UNDERLYING ASSUMPTION 10 Data have no meaning. Meaning is imposed through interpretation. Frames of reference, the way we see the world, influence the meaning we derive from data. Effective data users become aware of and critically examine their frames of reference and assumptions. Conversely, data can be a catalyst to rethinking our assumptions. Based on Bruce Wellman and Laura Lipton, Data-Driven Dialogue, 2004
BUILDINGTHE BRIDGE BETWEEN DATAAND RESULTS 11 Leadership & Capacity Structured Collaboration School Culture/Equity Instructional Improvement Varied & Frequent Data Use
COLLEGEAND CAREER READINESS FISHBONE 12 Varied and Frequent Data Use Leadership and Capacity Structured Collaboration College and Career Readiness for ALL Students Have Data School Culture and Equity Instructional Improvement Other
BUILDINGTHE BRIDGE BETWEEN DATAAND RESULTS 13 Leadership & Capacity
LEADERSHIP & CAPACITY 14 Director Jones When did you first realize the importance of instructional leadership at the school level? What are some of the major influences on your career as related to school improvement? Leadership Effective use of data
BASELINE DATA TN 3RD GRADE READING PROFICIENCY 15 Fentress County 2012 Reading 3rd Grade Reading Proficiency: 36.1% State Avg: 46.5% Image source: www.education-consumers.org/NAEP
16 FENTRESS BOE READING GOAL 90% of 3rd grade students in the Fentress County Schools will read at or above the 50th-percentile on a nationally normed reading test by Spring 2019 (six years). Adopted by the Fentress County Board of Education, October 9, 2013.
NON-NEGOTIABLES: 17 DISTRICT Monitor expectations Fidelity checks Inspect outcomes Instructional walkthroughs
NON-NEGOTIABLES: PRINCIPALS 18 Develop schedule to meet instructional needs 2 hours per day observing reading classrooms Review data; act on urgent items & compliance issues Monitor lesson gain charts for reading mastery Celebrate academic achievement Present MAP data twice a year to the Fentress BOE
NON-NEGOTIABLES: INSTRUCTIONAL COACHES 19 Provide academic support on basal reader Placement testing, grouping students, materials & supplies Provide specific training & support for RTI program
NON-NEGOTIABLES: TEACHERS 20 Use core basal with fidelity 60 mins whole-group reading instruction 60 mins differentiated small-group instruction PLC 1 time per week Use data to make instructional decisions
TURNN TALK 21 You just learned about Director Jones s journey to becoming a highly effective leader, the issues facing Fentress County in 2012, and the implementation of the district 90% goal and the non-negotiables. Consider: How does your district compare to this district? What are some areas that need improvement? What are strengths in your district you can leverage for this work?
BUILDINGTHE BRIDGE BETWEEN DATAAND RESULTS 22 Leadership & Capacity Structured Collaboration
STRUCTURED COLLABORATION 23 B A S E L I N E D A T A Data Workshops for District Leadership Book Study Professional Collaboration Data meetings Dialogue Leadership Collaboration Data-driven PLC meetings Dialogue Teacher Collaboration
STRUCTURED COLLABORATION 24 doesn t just happen and individuals don t automatically do it
BUILDINGTHE BRIDGE BETWEEN DATAAND RESULTS 25 Leadership & Capacity Structured Collaboration Varied & Frequent Data Use
VARIED & FREQUENT 26 DATA USE Director Jones What are the district expectations for using data? K-8 High School How often do the leaders and teachers make use of data in your district?
EXAMPLE: MAP DATA NORTHWEST EVALUATION ASSOCIATION MEASUREMENTOF ACADEMIC PROGRESS 27 MAP reveals class and individual skill deficits.
HIGH SCHOOL DATA USE: CASE ASSESSMENTS 29 Training and Education in the 21stCentury (E21 s CASE) Benchmark Assessments ACT preparation & support (Fentress) Gauge the academic progress of students Provide timely feedback that can be used by teachers to guide instruction Administered as nine-week assessments, mid-year assessments, or final comprehensive tests prior to administration of the state test Aligned to College- and Career-Ready Standards/Common Core State Standards (CCSS)
SPECIFIC EXAMPLESOF OTHER DATA 32 Students State achievement data Enrollment data (total and disaggregated by group) Dropout rates, attendance, retention Suspensions, discipline referrals Teachers Number of teachers Years of experience Percentage certified in field and highly qualified Community Demographics Average Income Level of education Average Age, etc.
BUILDINGTHE BRIDGE BETWEEN DATAAND RESULTS 33 Leadership & Capacity Structured Collaboration Instructional Improvement Varied & Frequent Data Use
INSTRUCTIONAL IMPROVEMENT: WALKTHROUGHS 34 All principals are required to spend a minimum of 2 hours per day in classrooms. Majority of the observations and feedback must be related to reading.
INSTRUCTIONAL IMPROVEMENT: WALKTHROUGHS 35
Effective Feedback 37 Your plans called for students to write their high frequency words on a marker board, just don t forget the sentence that students are supposed to construct with the words, as well. This could be done aloud pretty quickly with the 5W cards used to extend at times. (If you want a copy of those just let me know.) Students also seemed to get tired of waiting while you were supporting the little girl who struggled. Since these are high frequency words and time is always a factor, it may be helpful at that point to just show the student the word for them to copy. Also, with some of the behaviors that students are showing, the t/s game may be helpful support to encourage more positive behavior. Thanks for your hard work!
BUILDINGTHE BRIDGE BETWEEN DATAAND RESULTS 38 Leadership & Capacity Structured Collaboration School Culture/Equity Instructional Improvement Varied & Frequent Data Use
SCHOOL CULTURE & EQUITY 39 Director Jones How would you describe your school culture now that Fentress County is making steps towards increased academic success? How has being a distressed Appalachian county influenced Fentress County s journey?
BUILDINGTHE BRIDGE BETWEEN DATAAND RESULTS 40 Leadership & Capacity Structured Collaboration School Culture/Equity Instructional Improvement Varied & Frequent Data Use
2012 BASELINE DATA TN 3RD GRADE READING PROFICIENCY 41 Fentress County 2012 Reading 3rd Grade Reading Proficiency: 36.1% State Avg: 46.5% Image source: www.education-consumers.org/NAEP
2015 READING RESULTS 42 Fentress County 2015 Reading 3rd Grade Reading Proficiency: 40.6% State Avg: 43%
2015-2016 ENGLISH ONTRACKORMASTERED ENG. I, II AND III COMBINED UPPER CUMBERLAND 43 STATE AVERAGE 30.4 Red Boiling Springs Clarkrange 40.2 Sequatchie Co. 31.9 26.4 CCHS 38.8 White Co. 30.1 Clay Co. 25.7 Gordonsville 28.6 Macon Co. 25.2 York 38.6 Smith Co. 28.1 Upperman 22.2 Cookeville 38.3 Dekalb Co. 27.5 Van Buren Co. 22 Trousdale Co. 38.3 Jackson Co. 27.4 Warren Co. 22 Pickett Co. 37.3 Coffee Co. 26.7 Bledsoe Co. 20.7 Stone 35.2 Coffee Raider Academy Cannon Co. Monterey 26.6 26.5 Phoenix School 15.9 33.7 33.3 Livingston
2015-2106 MATH ONTRACKOR MASTERED UPPER CUMBERLAND ALGEBRA I, II AND GEOMETRY COMBINED 44 State Average 20.8 Sequatchie Co. 15.4 Trousdale 38.7 Clay Co. 23.3 Pickett Co. 14.7 Livingston 36.5 Bledsoe Co. 23.1 Coffee Co. Raider Academy Warren Co. 12.3 CCHS 31.3 22.7 Cannon Co. 10.6 Cookeville 30.3 Upperman 19.7 Dekalb Co. 10.3 Smith 28.5 Macon Co. 18.8 Jackson Co. 9.1 Gordonsville 28.4 York 18.1 Van Buren Co. 4.9 White 28.3 Monterey 7.2 Phoenix School 3.2 Stone 27.8 Coffee Co. Red Boiling Springs 17.0 16.0 Clarkrange 23.3
2015-2016 SCIENCE ONTRACKOR MASTERED UPPER CUMBERLAND BIOLOGYAND CHEMISTRY COMBINED 45 State Average 48.9 Trousdale Co. 69.8 Coffee Co. 53.9 Cannon Co. 29.9 Livingston 64.7 CCHS 51.8 Bledsoe Co. 39.4 Red Boiling Springs Sequatchie Co. 63.7 Clay Co. 52.0 39.0 Clarkrange 60.5 Upperman 47.9 Gordonsville 38.7 White Co. 59.8 Smith Co. 47.6 Monterey 36.2 Cookeville 58.6 Macon Co. 45.3 Pickett Co. 32.8 Stone 58.4 Warren Co. 44.2 Phoenix School 10.4 Dekalb Co. Jackson Co. 58.0 55.3 York Van Buren Co. 42.9 41.4
2015-2016 US HISTORY ONTRACKORMASTERED UPPER CUMBERLAND REGION 46 State Average 29.9 Smith Co. 29.9 Bledsoe Co. 20.4 Clarkrange 62.5 CCHS 29.8 Trousdale Co. 19.1 York 60.2 Jackson Co. 28.6 Monterey 17.2 Stone 53.7 Dekalb Co. 27.3 Gordonsville 14.5 White Co. 53.1 Livingston 26.8 Van Buren Co. 13.9 Upperman 39.1 Warren Co. 24.7 Phoenix School 8.4 Cookeville 38.5 Pickett Co. 23.8 Cannon Co. 33.4 Macon Co. Coffee Co. 22.5 22.0 Red Boiling Springs Sequatchie 31.9 30.9
QUESTION & ANSWER 47 What questions do you have for Director Jones? What questions do you have for TnACHE?
THINKING FORWARD 48 What could you do if the prize was improved ACT Scores? What would constitute the building blocks of the pyramid to reach the prize? How do you know? How could you find out? Where should you start? ACT
THANKYOU! 49 Mr. Mike Jones, Director of Schools, Fentress County mike.jones@fentressboe.com Dr. Terry Lashley, Executive Director, TnACHE terry.lashley@southeasted.com Ms. Diane Vaughn, Educational Specialist diane.vaughn@southeasted.com