Updates to Isolation Index and Targeted Funding for Remote Schools
The Isolation Index introduced in 2001 to identify remote schools is being updated to better allocate funding based on isolation levels. Changes include using updated population and road data, redefining isolation criteria, and revising funding formulas. The goal is to accurately support the most isolated schools and ensure fair resource distribution. The new system will evaluate distance and travel time from population centers, reducing the largest center size considered. This update aims to address feedback on the previous system and enhance support for isolated schools.

Download Presentation

Please find below an Image/Link to download the presentation.
The content on the website is provided AS IS for your information and personal use only. It may not be sold, licensed, or shared on other websites without obtaining consent from the author.If you encounter any issues during the download, it is possible that the publisher has removed the file from their server.
You are allowed to download the files provided on this website for personal or commercial use, subject to the condition that they are used lawfully. All files are the property of their respective owners.
The content on the website is provided AS IS for your information and personal use only. It may not be sold, licensed, or shared on other websites without obtaining consent from the author.
E N D
Presentation Transcript
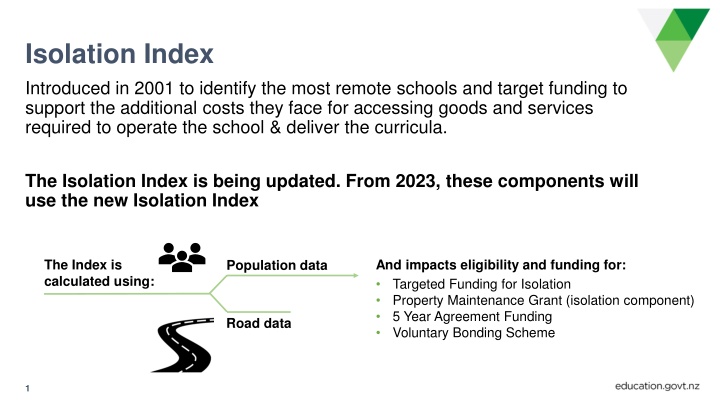
Isolation Index Introduced in 2001 to identify the most remote schools and target funding to support the additional costs they face for accessing goods and services required to operate the school & deliver the curricula. The Isolation Index is being updated. From 2023, these components will use the new Isolation Index The Index is calculated using: And impacts eligibility and funding for: Targeted Funding for Isolation Property Maintenance Grant (isolation component) 5 Year Agreement Funding Voluntary Bonding Scheme Population data Road data 1
How does it work? The Isolation Index measures the distance from each school to the nearest population centres of 5,000, 20,000 and 100,000 people. Uses 2001 population and road data Schools isolation index numbers range from 0.01 to 7.1 for schools on the mainland Off-shore islands are given a notional index value Note that due to changes to the Isolation Index from 2023, the scale of the index has changed. This means your old and new isolation numbers are not comparable. Population centre 100,000 Population centre 20,000 Population centre 5,000 Old Isolation Index New Isolation Index Scale 0.01 7.1 Mean 0.91 Median 0.71 Scale 0.01 6.63 Mean 0.75 Median 0.41
Why is it changing? Feedback in 2017 from a group of principals from small and isolated schools Isolation costs do not increase with roll size smallness compounds isolation Level of isolation is determined by both distance and travel time Current index uses outdated population and road data from 2001 The changes will help us to better identify and resource our most isolated schools and kura
Isolation Index and Targeted Funding for Isolation changes Current isolation index formula Distance from three population centres 2001 census population data 2001 road data to measure distance Largest population centre 100,000 or less New isolation index formula Both distance and travel time from three population centres 2018 census population data 2020 road data to measure distance and travel time Reduces largest population centre to 60,000 or less New Targeted Funding for Isolation formula Removing per pupil component following sector feedback From 2023, isolated schools will receive TFI based on a base rate per school and their level of isolation
Distance and travel time analysis Distance and time are calculated independently by a specialist Geographic Information Systems company. Road data is sourced from local authorities and government agencies (e.g. NZTA). Business rules are applied so data is treated consistently. Distance and travel time are defined as: Distance Travel time An average of the actual speed when driving between locations using the same roads as the distance calculation Measured on the fastest route over navigable public roads
Transition approach The EQI and new Isolation Index are being implemented at the same time to reduce the burden of change on schools Majority of schools and kura see an increase in funding from these combined changes Funding will be better targeted as we can better identify schools facing the greatest barriers No school will experience a reduction in their per-student equity and isolation funding in 2023 due to these changes From 2024 onwards, schools reductions in funding are capped at a max of 5% pa to phase transition funding overtime