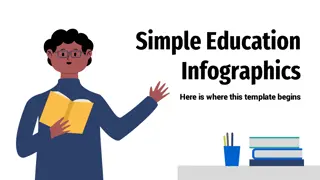
Unlocking the Power of Infographics: A Visual Guide

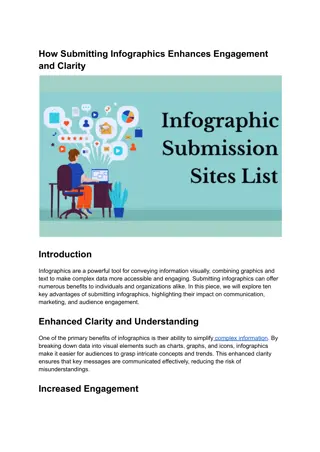
Infographics are a popular way of presenting information due to their clear, colorful, and easily-understood nature. They help convey complex information quickly, making them valuable tools for researchers, educators, journalists, marketers, and more. This guide provides insights on what infographics are, why they are effective, who uses them, and tips for creating compelling infographics that flow naturally and engage readers.

Download Presentation

Please find below an Image/Link to download the presentation.
The content on the website is provided AS IS for your information and personal use only. It may not be sold, licensed, or shared on other websites without obtaining consent from the author.If you encounter any issues during the download, it is possible that the publisher has removed the file from their server.
You are allowed to download the files provided on this website for personal or commercial use, subject to the condition that they are used lawfully. All files are the property of their respective owners.
The content on the website is provided AS IS for your information and personal use only. It may not be sold, licensed, or shared on other websites without obtaining consent from the author.
E N D
Presentation Transcript
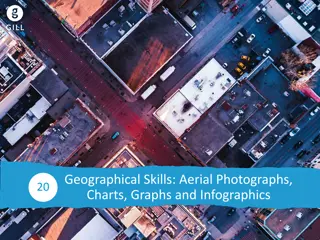
INFOGRAPHICS Aoife O Driscoll www.aoifesnotes.com
Infographic The word comes from Informational Graphic
What is an infographic and why is it such a popular way of providing information? Charts, images, diagrams and a little text Images are usually clear, colorful and striking The purpose of an infographic is to convey complicated information clearly and quickly Infographics provide a quick overview They are easily-understood
Who uses infographics? Researchers presenting findings Educators presenting complex material Journalists analysing a topic Charities and organisations raising awards about issues People in marketing who want to improve brand awareness Project managers explaining timelines to clients Etc.
Tips for creating a good infographic Graphics should be clear and simple Avoid using too many colours Keep text to a minimum Make sure the language is straightforward and readable Make sure your infographic flows naturally and makes sense to the reader Don t repeat yourself


![textbook$ What Your Heart Needs for the Hard Days 52 Encouraging Truths to Hold On To [R.A.R]](/thumb/9838/textbook-what-your-heart-needs-for-the-hard-days-52-encouraging-truths-to-hold-on-to-r-a-r.jpg)