Understanding Tipping Points in Ecological and Economic Systems
Delve into the complex dynamics of tipping points in ecological systems such as insect outbreaks, eutrophication of lakes, and bleaching of coral reefs, as well as their economic implications. Explore the interactions between human behavior and environmental factors, and the challenges in managing these systems to prevent catastrophic shifts. Learn about models and frameworks used to analyze tipping points and their significance in sustainable resource management.
Download Presentation

Please find below an Image/Link to download the presentation.
The content on the website is provided AS IS for your information and personal use only. It may not be sold, licensed, or shared on other websites without obtaining consent from the author. Download presentation by click this link. If you encounter any issues during the download, it is possible that the publisher has removed the file from their server.
E N D
Presentation Transcript
The Economics of Tipping Points Aart de Zeeuw Tilburg University, the Netherlands Beijer Institute, Stockholm, Sweden
Introduction 1 Tipping points in ecological systems insect outbreaks (Ludwig et al., 1978): natural system eutrophication of lakes (Carpenter, Scheffer, 1997) bleaching of coral reefs (Hughes et al., Science, 2003) planetary boundaries (Rockstr m et al., Nature, 2009) Characteristics multiple equilibria, bifurcations, domains of attraction hysteresis, irreversibility uncertainty tipping 19 September 2024 2
Introduction 2 Economics characterize damage after tipping characterize uncertainty trade-offs, optimal management? Common property issues? Two types of models convex-concave (non-linear) model: lake, coral reef, forest hazard-rate model: fisheries, climate change tipping 19 September 2024 3
Tipping points/Regime shifts Catastrophic shifts in ecosystems Scheffer et al (Nature, 2001, 4279 citations) Tipping points in social systems Gladwell (paperback, 2000) fashion, smoking, financial system (?) Lake model: socio-ecological model type-III S-shaped functional response (Holling, 1959) influenced by human behavior: level of phosphorus loading tipping 19 September 2024 4
tipping 19 September 2024 5
Lake model Carpenter, Scheffer, 1997 (plus L-equation) P: phosphorus in lake water; L: total loading on lake; M: phosphorus in surface sediment (slow) Too complicated for economists! Fix M first. 2 ( ) P t = + + = ( ) ( ) ( ) ( ) h P t , (0) P P t L t s rM P 0 + 2 2 ( ) P t m 2 ( ) P t = = ( ) ( ) ( ) ( ) , (0) M t sP t bM t rM t M M 0 + 2 2 ( ) P t m tipping 19 September 2024 6
Lake equilibria (a is L, x is P) tipping 19 September 2024 7
Economics Conflicting services waste sink for agriculture (by-product of production) damage to water, fish, amenities (eutrophication) Common property, game theory, taxes on loadings n = max [ln ( ) 2 t ( )] , L t cP t e dt L L i = 1 i 0 2 ( ) P t = + + = ( ) ( ) ( ) ( ) h P t , (0) P P t L t s rM P 0 + 2 2 ( ) P t m tipping 19 September 2024 8
Lake management Transformation (Ludwig) x = P/m, a = L/rM, b = (s+h)m/rM, time scale rMt/m, new c parameters b (nature) and c (humans) Small x: oligotrophic, large x: eutrophic n = max [ln ( ) 2 t ( )] , a t cx t e dt a a i = 1 i 0 2 ( ) x t = + = ( ) x t ( ) ( ) , (0) x a t bx t x 0 + 2 ( ) 1 x t tipping 19 September 2024 9
Static optimization Starting with high c and decreasing c: one global oligotrophic maximum global oligotrophic maximum and local eutrophic maximum local oligotrophic maximum and global eutrophic maximum Can maximum be reached with fixed loading a? 2 max{ln } a cx 2 x = a bx + 2 1 x tipping 19 September 2024 10
Dynamical optimization Current-value Hamiltonian function Pontryagin s maximum principle a = -1/ , dynamical equation in loading a Phase diagram (b = 0.6, c = 1, = 0.03) 2 x = a cx + a bx + 2 ( , , ) H x a ln ( ) + 2 1 x 2 ( ) ( ) 1) x t x t = + ) ( ) 2 ( ) ( ) a t cx t a t + 2 ( ) ( a t b + 2 2 ( tipping 19 September 2024 11
Optimal loading path tipping 19 September 2024 12
Lower c (c = 0.5) tipping 19 September 2024 13
Result For high c = 1, one (saddle-point stable) steady state in the oligotrophic area of the lake For lower c = 0.5, two (saddle-point stable) steady states, one in the oligotrophic area and one in the eutrophic area of the lake; the optimal loading path depends on the initial condition of the lake Skiba indifference point convex-concave production functions (Skiba, E trica, 1978) tipping 19 September 2024 14
Common property Game: Nash equilibrium Current-value Hamiltonian functions (n = 2) ai = -1/ i, dynamical equation in total loading a For n = 2 and c = 1, the same as before for c = 0.5! 2 x = + + + 2 ( , , ) i H x a ln ( ) a cx a a bx i i i i i j + 2 j i 1 x 2 ( ) x t x t c n = + + 2 ( ) ( ) ( ) 2 a t ( ) ( ) x t a t a t b + 2 2 ( ( ) 1) tipping 19 September 2024 15
Result For c = 1 and n = 2, two Nash equilibria Both are possible in a range of initial conditions no Skiba indifference point The users can coordinate on the good Nash equilibrium but are trapped in the bad Nash equilibrium beyond a certain level of pollution Regulating tax works for small n, but not for big n M ler, Xepapadeas and de Zeeuw, ERE, 2003 tipping 19 September 2024 16
Second type of model Abrupt shift to different system dynamics (regime) shock to a system parameter carrying capacity in fishery (Polasky et al., JEEM, 2011) total factor productivity in economic growth, due to climate change (Lemoine, Traeger, AEJ, 2014; Cai, Judd, Lontzek, 2015; van der Ploeg, de Zeeuw ERE, 2016. JEEA, 2018) Uncertainty Hazard rate model event probability, Poisson process tipping 19 September 2024 17
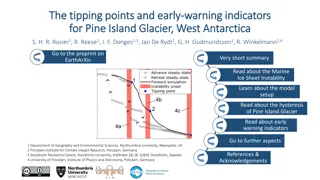
Probabilities of Various Tipping Points from Expert Elicitation Duration before effect is fully realized (in years) Additional Warming by 2100 Possible Tipping Points 1.5- 3.0C 0.5-1.5 C 3-5 C Reorganization of Atlantic Meridional Overturning Circulation about 100 0-18% 6-39% 18-67% Greenland Ice Sheet collapse at least 300 8-39% 33-73% 67-96% West Antarctic Ice Sheet collapse at least 300 5-41% 10-63% 33-88% Dieback of Amazon rainforest about 50 2-46% 14-84% 41-94% Strengthening of El Ni o-Southern Oscillation about 100 1-13% 6-32% 19-49% Dieback of boreal forests about 50 13-43% Not formally assessed Not formally assessed. 20-81% 34-91% Shift in Indian Summer Monsoon about 1 Release of methane from melting permafrost Less than 100
Tipping point At some time t a regime shift may occur Hazard rate h probability that regime shift occurs between t and t + t, given that it has not occurred before t average time until the shift occurs is 1/h Indicator for the lack of resilience of the system Hazard rate depends on accumulated greenhouse gases P (warming, h (P) > 0): endogenous! tipping 19 September 2024 19
Ramsey growth model Utility U, consumption C, capital K, production F (TFP = A), net production Y, parameters , Golden Rule for steady state: Y (K*) = Fossil fuel in production, climate change affects A t max ( ( )) U C t dt e 0 = = ( ) K t ( ( )) ( ) ( ) ( ( )) Y K t ( ) AF K t K t C t C t ( ) '( ( )) ( ) Y K t = ( ) t t t tipping 19 September 2024 20
Ramsey growth with tipping Utility U, consumption C, capital K, fossil fuel E with cost d, renewables R with cost c, stock of carbon P, production function F, parameters , , , Calibrated model for the world economy, = 0.2 ( ) = cR C , , K AF K E R dE K t max E C E R ( ( )) U C t dt e = = ) , A t , , (1 A A t T A T , , 0 = P E P tipping 19 September 2024 21
Analysis Maximize w.r.t. E and R, define net production Y After tipping: standard Ramsey growth model with optimal consumption path CA Before tipping: special Ramsey growth model with in each time interval t to t + t the probability h(P) that consumption switches to CA instead of continuing CB Adjusted Golden Rule for steady state KB*! Tax path on fossil fuel to keep probability h(P) down tipping 19 September 2024 22
Precautionary saving Adjusted Golden Rule Consumption functions CB(K) before tipping and CA(K) after tipping Precautionary return If consumption drops after tipping, marginal utility is higher, so that > 0 and KB*> K* A '( '( ( ) ( ) K U C U C K = = ( ) K ( ) h P 1 0 * * B B Y K '( ) ( ) K B tipping 19 September 2024 23
Capital tipping 19 September 2024 24
Consumption tipping 19 September 2024 25
Fossil-fuel tax Shadow value on accumulation of greenhouse gases Tax on fossil fuel or SCC (Social Cost of Carbon) Three components: usual marginal damages risk-averting component (tipping) raising-the stakes component (after tipping) Interplay between precautionary saving and reducing greenhouse gas emissions tipping 19 September 2024 26
Steady-state Na ve Linear Quadratic solution 378 57.1 9.0 11.3 1502 11.79 hazard 492 58.3 7.7 12.1 1287 11.85 1.10 4.3 hazard 465 58.3 7.0 11.9 1160 11.88 0.90 5.7 K* C* E* R* P* Capital stock Consumption Fossil fuel use Renewable use Carbon stock Total factor productivity Precautionary return Social cost of carbon, A(P*) * 15.4 marginal 35.0 51.9 Social cost of carbon, disaster 15.4 13.7 Social cost of carbon, stakes 15.4 54.8 71.2 Social cost of carbon, * total tipping 19 September 2024 27
Conclusion Tipping points (or regime shifts) exist in natural systems and require adjustments in economics The lake model and the hazard rate model Skiba points and pollution traps in the lake model Adjusted golden rule in the Ramsey growth model Much higher fossil-fuel tax, mainly to avoid risk Behavioral tipping points?! tipping 19 September 2024 28
Thank you for your attention! complexity 19 September 2024 29
