Understanding the US Homicide Epidemic: A Comparative Analysis
The statistics on homicides and gun-related homicides in the US are derived from death certificates and FBI reports, revealing a concerning trend of violence compared to other OECD countries. Variances in homicide rates by location and demographics are highlighted, with alarming rates in cities like New Orleans and Baltimore. The US total homicide rate is approximately 5 per 100,000, with notable discrepancies across different cities.

Download Presentation

Please find below an Image/Link to download the presentation.
The content on the website is provided AS IS for your information and personal use only. It may not be sold, licensed, or shared on other websites without obtaining consent from the author. Download presentation by click this link. If you encounter any issues during the download, it is possible that the publisher has removed the file from their server.
E N D
Presentation Transcript
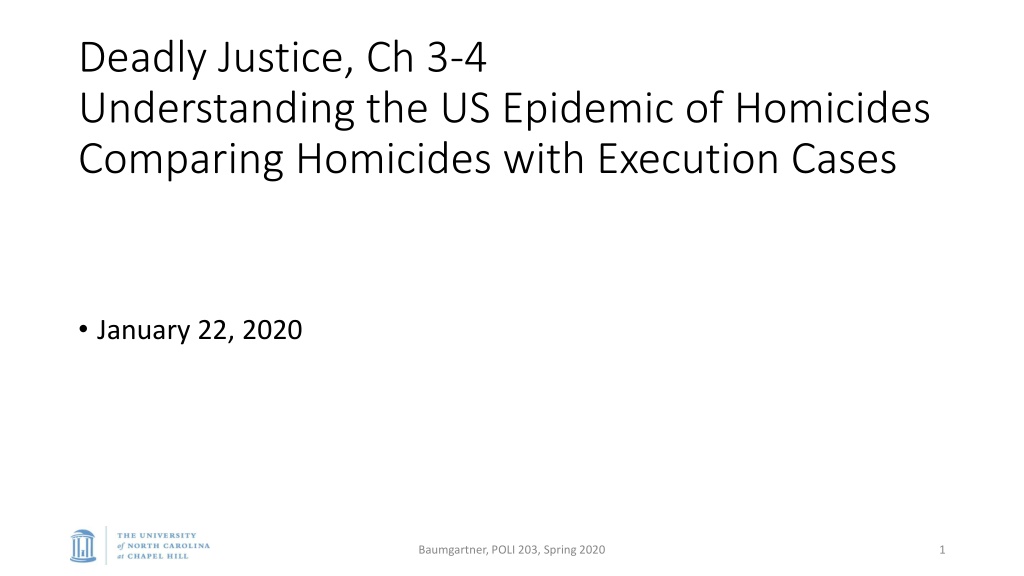
Deadly Justice, Ch 3-4 Understanding the US Epidemic of Homicides Comparing Homicides with Execution Cases January 22, 2020 Baumgartner, POLI 203, Spring 2020 1
Where do these statistics come from? Centers for Disease Control Whenever a person dies, a death certificate lists the cause of death Hundreds of causes of death: pneumonia, heart attack, etc. Several fall into the category of homicide These are aggregated by county and state After 1995, privacy controls stop distribution of county except for largest counties. Gggrrrr! Frustrating to people like me who want good stats Good: Every death. Bad: no information about who killed them. Also, listed by county of residence of the person, not necessarily where they passed away. FBI Supplemental Homicide Reports lists data on offender, victim, nature of the crime, etc. Great stuff, but often missing. If the crime is not solved, no data. If the local police department forgets to send in the form, no data. Baumgartner, POLI 203, Spring 2020 2
Deaths: 2.5million per year, homicides: 10- 25k; gun-related homicides: 5-15k (CDC data) Baumgartner, POLI 203, Spring 2020 3
Since 1972 100,000,000 deaths 900,000 homicides 600,000 gun-related homicides Baumgartner, POLI 203, Spring 2020 4
US rate per population compare to others. Were so much more violent than other OECD countries Baumgartner, POLI 203, Spring 2020 5
These differ a LOT by: place, and by demographics. Some homicide rates compared, 2019 Chapel Hill New City Durham Orleans New York City Baltimore Population 60,000 263,000 393,000 8,623,000 620,000 Homicides 1 41 119 299 348 rate per 100k 1.7 16 31 3.5 56 Baumgartner, POLI 203, Spring 2020 6
From Table 3.2: Homicide rates per 100,000 US total: about 5 per 100,000. New Orleans: 70 St. Louis: 48 DC: 44 Baltimore: 44 Richmond: 42 Detroit: 29 Reference: Most violent countries in the world: Honduras (84); El Salvador (40); S. Africa (32); Colombia (32); Brazil (26). Baumgartner, POLI 203, Spring 2020 7
Racial breakdown of who dies, and who dies by homicide (males, blacks more likely) Baumgartner, POLI 203, Spring 2020 10
Homicides tend to be: Male, within race, and there is a higher rate among blacks, both as offenders and as victims Offenders Victims Baumgartner, POLI 203, Spring 2020 11
Who kills whom? Killers tend to be men, and they kill people of their own race, typically also men. Baumgartner, POLI 203, Spring 2020 12
Homicide victimization varies not just by geography, but by demographics, as well. Black male victims of homicide, by age, wow. Baumgartner, POLI 203, Spring 2020 13
A summary Very high rates across the US. Dramatic increase from 1960s to 1980s, big decline since mid-1990s. New Orleans, some other hot-spots, crazy rates of homicide.. But homicide is very rarely random. Typically the people know each other, and typically they are from similar social backgrounds. A young man s game. Both offenders and victims are young men. Generally (80-90 percent), within race. Generally male victims. Target homicide victim: young black men. (Their killers, however, are rarely targeted for capital punishment.) Baumgartner, POLI 203, Spring 2020 14
Chapter 4: OK, we know about homicides; which of these lead to executions? Data from Chapter 3 from FBI crime reports, and a summary database linking victims and offenders. Obviously, those require the police to be involved, and the victim-offender data require the crime to be solved. This chapter: comprehensive database on all executions. Same as the DPIC database. https://deathpenaltyinfo.org/views-executions For each person executed, who was their victim? Who were they? Baumgartner, POLI 203, Spring 2020 15
Some drawbacks / caveats / imperfections Executions are only a small fraction of death sentences, and some states have lots of death sentences but few executions. Many homicides are not capital-eligible. But: things correlate over time (e.g., more homicides = more capital eligible homicides); other studies with more detail confirm the same patterns; this approach is completely comprehensive and intuitive: all homicides v. all executions. Baumgartner, POLI 203, Spring 2020 16
OK, the simple statistics See also this article for a breakdown state-by-state: Baumgartner, Frank R., Emma Johnson, Colin Wilson, and Clarke Whitehead. 2016. These Lives Matter, Those Ones Don t: Comparing Execution Rates by the Race and Gender of the Victim in the US and in the Top Death Penalty States. Albany Law Review 79, 3: 797 860. http://www.unc.edu/~fbaum/articles/TheseLivesMatter- AlbanyLawReview2016.pdf Baumgartner, POLI 203, Spring 2020 17
By Race and Gender of the Victim Race Gender Baumgartner, POLI 203, Spring 2020 18
Executions as percent of homicides, by race and gender of victim Baumgartner, POLI 203, Spring 2020 19
Whites rarely executed for killing blacks (See Table 4.3) Victim Black Male Offender White Female White Male Black Female Percent White Total White Black WF 1 9 0 0 10 10 0 100.00 WM 317 401 9 11 767 718 20 97.29 BF 1 0 0 3 4 1 3 25.00 BM Total White Black 121 473 318 122 162 623 410 162 64 78 99 478 1,422 777 482 283 1096 728 284 163 198 20 166 63.45 84.70 97.33 63.11 120 11 102 9 64 Baumgartner, POLI 203, Spring 2020 20
Multiple victims Timothy McVeigh was white, and he had black victims. But he had 163 victims, and it just so happened that some were black. It was not a racial crime; it was an attack on the federal government 20 whites have been executed for killing blacks Think about that. Among those with just a single victim, the number is even lower. Without going into the horrific details, these tend to be crimes of explicit racial animus: KKK, Aryan Nations, things like that. Without explicitly claiming racial hatred (like Dylan Roof), it is almost statistically impossible for a white to be executed for killing a black Baumgartner, POLI 203, Spring 2020 21
In many states, it has never happened Louisiana: 61 percent of homicide victims are black males Execution rates per 1,000 homicides: Black male victim: 0.24 Black female victim: 2.06 White male victim: 3.01 White female victim: 11.52 Last execution of a white for killing a black: drum roll 1752. Under French rule. Baumgartner, Frank R., and Tim Lyman. 2015. Race-Of-Victim Discrepancies in Homicides and Executions, Louisiana 1976-2015. Loyola University of New Orleans Journal of Public Interest Law 17: 128-44. Baumgartner, POLI 203, Spring 2020 22
Female killers executed (Table 4.4) 16 females executed (the first was here in NC: Velma Barfield, aka the black widow ). (Women: 10 percent of killers, but 1 percent of executed) Together, they had 21 victims Of these victims, only 4 were strangers The vast majority were: Husband / partner Child Our greatest fears, toughest sanctions: Man who attacks a random white female, especially if the killer is black male Woman who kills her husband or child Therefore, it s logical to think that the opposite groups are under-valued: Man who kills a spouse or acquaintance Anyone who kills a black victim, especially if the killer is white Baumgartner, POLI 203, Spring 2020 23
The patterns are pretty dang clear. There is a hierarchy of which cases are likely to lead to execution: The hierarchy of victims White female White male Black female Black male The hierarchy of offenders Black male White male Black female White female Baumgartner, POLI 203, Spring 2020 24
Other things that increase the odds Crime occurs in Houston TX Crime occurs in another jurisdiction that is active (more on this in Chapter 6) Crime occurs in the 1980s You have a bad lawyer You have other vulnerabilities (e.g., mental capacity, mental illness) Your case generates media coverage You are portrayed as an animal, a savage, a predator (Note: OJ Simpson was never even considered, though he was black and was charged with a double-murder of whites, with a knife. But he was too well known, could not be othered everyone felt they knew him ) Baumgartner, POLI 203, Spring 2020 25
Garden-variety v. particularly heinous murders Inevitably, capital punishment, if not to be the automatic punishment for homicide, requires the creation of two classes of victims, or of homicides. One class is lower garden variety One class is higher more serious, worthy of the greatest punishment Very difficult to make this distinction. Particularly given McGautha: no clear instructions! Baumgartner, POLI 203, Spring 2020 26


")