Understanding the Challenges and Opportunities of Aging Population in Nebraska
Exploring the impact of demographic shifts on Nebraska's population, this collection of images sheds light on the unique challenges faced by seniors, including housing affordability, mobility issues, and social engagement. With insights into the growing senior population and the need for accessible public spaces, it prompts a reflection on the readiness of communities to support the aging demographic.
Download Presentation

Please find below an Image/Link to download the presentation.
The content on the website is provided AS IS for your information and personal use only. It may not be sold, licensed, or shared on other websites without obtaining consent from the author. Download presentation by click this link. If you encounter any issues during the download, it is possible that the publisher has removed the file from their server.
E N D
Presentation Transcript
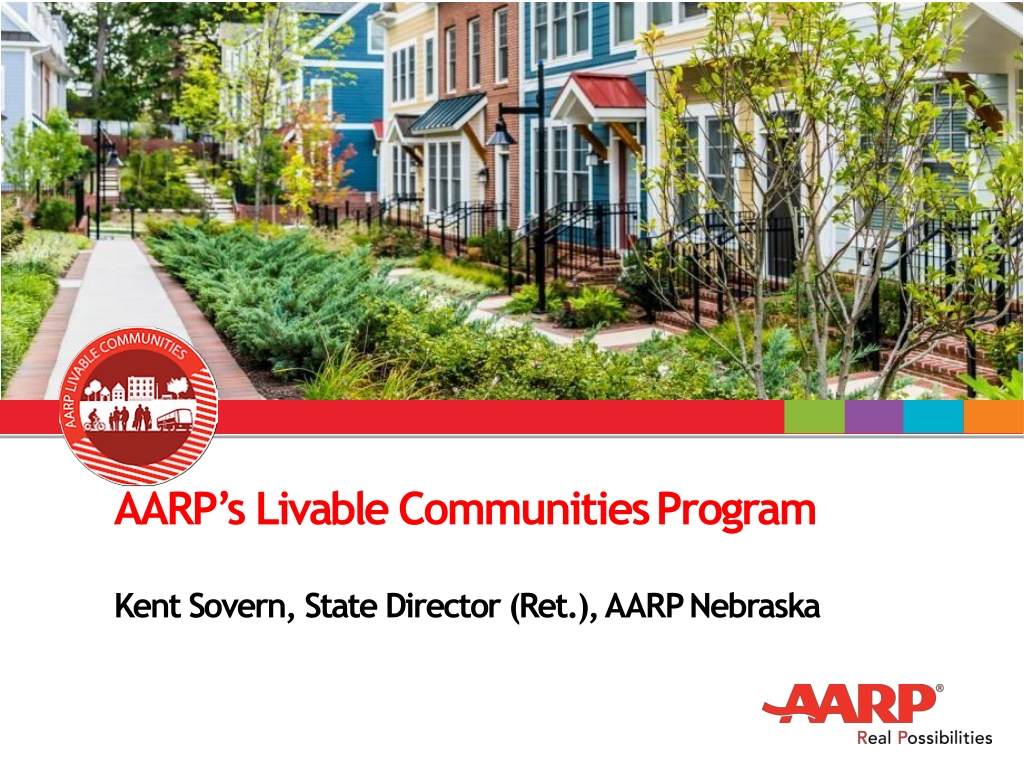
AARPs Livable CommunitiesProgram Kent Sovern, State Director (Ret.),AARPNebraska
Demographic tippingpoint March 13,2018 2
Theopportunity PERCENT OF POPULATION AGE65+ Source: US Census 3
By2050: More than 1/3 of Nebraskans will be over50 Source: MAPA 2050 LRTPMemo 4
Behind the numbers, a deeperstory PUBLICSPACES HOUSING Seniors comprise 20% of general population butonly 4% of parkusers More than 50% of renters 65+ were rent-burdened (paying more than 30% of income for housing) in 2015,up from 43% in2001 MOBILITY ISOLATION The average American man outlives his abilityto drive by six years; the average American woman, by 10years Isolation and loneliness areworse for health than obesity. The health risks of prolongedisolation = smoking 15 cigarettes/day 5
Behind the numbers, a deeperstory AGING INPLACE SHARE OF PEDESTRIAN FATALITIES 75% of people 50+ want to age in their same home and/or same community; increases to 90%for 65+ People 65 or older were over- represented in pedestrianfatalities in 35states. OLDERADULTS BIKING butno growth in older adults biking from 2009to2017 OLDERADULTS WALKING Walking trips upby seniors from 9 to 14% from 2009to 2017 6
Are weready? Are there adequatehousing options that are affordable, accessible and varied in type? Are there ways toremain mobile once driving isno longer anoption? Are thereopportunities for civic and social engagement through volunteerism, work, other? Is there adequate,safe and accessible public space? 7
TOO MUCH OFTHIS NOT ENOUGH OFTHIS 8
Ourapproach Support Communities +Community Leaders Equip AARP StateOffices EnlistPartners 9
We are IN yourcommunity and 43 other states andterritories 10
AARP Network of Age-Friendly States andCommunities 365+communities 5states 12
Developing an age-friendly community: thefoundation The 8 Domains of Livability 13
Developing an age-friendly community: theprocess Year 5: Progress / statusupdate Years 3-5: Implementation Year 2: Create an actionplan Year 1: Conduct asurvey and listeningsessions Enrollment 14
Information and tools you can use: free in print or download www.aarp.org/livable 16
Resources to invest in quick-actionchange Alleyactivation(WI) Trails andsignage(MT) Medicinal planter boxes(AK) Parklets(MS) 18
Is itworking? 2019 NAFSC Survey; nearly one-third enrolledresponded 42% of respondents achieved a change in publicpolicy Most common success: integrating an age-friendly lens into communityplan Most frequent wins by category: housing, transportation, outdoorspaces and buildings, health and community services 20% of respondents achieved a private sector investment oraction Most frequent wins by category: housing, health and communityservices, communication andinformation 75% of respondents described other successes categorized as: Raising awareness of livableissues Increase collaboration within community Enact programs in accordance with ActionPlan Integrate age-friendly lens into strategicplanning 19
For moreinformation: www.aarp.org/livable Danielle Arigoni, Director of Livable Communities, AARP darigoni@aarp.org @aarplivable @daniellearigoni THANKYOU! 20
