Understanding Tephigrams: A Guide to Assessing Soaring Conditions
Tephigrams are valuable tools for determining ideal soaring conditions by displaying temperature and dew point information versus height, assessing thermal activity, and understanding atmospheric stability. They provide insight into dry and saturated lapse rate curves, wind information, and the characteristics of a good thermal day. By analyzing tephigrams, pilots can make informed decisions for gliding and soaring activities based on meteorological data and conditions.

Download Presentation

Please find below an Image/Link to download the presentation.
The content on the website is provided AS IS for your information and personal use only. It may not be sold, licensed, or shared on other websites without obtaining consent from the author. Download presentation by click this link. If you encounter any issues during the download, it is possible that the publisher has removed the file from their server.
E N D
Presentation Transcript
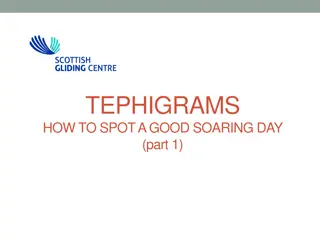
TEPHIGRAMS HOW TO SPOT A GOOD SOARING DAY (part 2)
Tephigrams what do they do? Two separate functions 1. Display air temperature and dew-point data versus height above a given location at a given time wind velocity with height is shown as well always check the location, time and date 2. Permit quick, basic assessment of thermal activity via calculating curves also useful for spotting potential wave days
Tephigram from RASP Wind info Air temp Dewpoint temp Height Temp
Tephigrams Dry Adiabatic Lapse Rate Curves these apply in clear air
Tephigrams Saturated Adiabatic Lapse Rate Curves these apply in clouds
Tephigrams stability, whats that? Atmospheric stability is a very important factor in the formation of thermals and wave as they depend upon the right degree of stability (or instability) In the atmosphere, stability means that if a parcel of air is displaced up or down from an initial height, the parcel will tend to return to that initial height. What makes a parcel of air return to the level it came from? As a parcel of air rises it expands and cools. This cooling is caused by the expansion and is not due to the surrounding air If the temperature of the parcel drops so that it is the same or less than the surrounding air it will stop rising and start to descend as it will be more dense than the surrounding air And vice versa for air descending from its initial height For this to happen the change in the parcel temperature with height must be more than thechange in the surrounding air temperature with height
Tephigrams - stability Stable layer
Tephigrams - a good thermal day Lower air temperature profile follows dry (clear air) curves from the ground up (well mixed layer) 1. A stable layer / inversion at a reasonable height (top of thermal) 2. Cloudbase present at a reasonable height (not blue thermals) 3. Dry air above cloud level to minimise cumulus spread-out 4. Low wind speed (<15kts) within thermalling layer 5. No or thin upper cloud cover 6.
Tephigram a good thermal day Wind info Air temp Dewpoint temp 4.Dry air Height 2.Inversion 3. Cumulus cloud? 5. Low windspeed 1.Well-mixed layer Temp
Tephigrams - a good wave day 1. Wind speed > 10-15kts at hill tops (~3-4000 ) and gradually increasing with height Not too windy at cruising level (<50kts) 2. Wind direction relatively constant with height and from SW to N (at Portmoak) 3. Inversion or isothermal layer present at height of hill tops/ridges 4. Stable, relatively dry air above and below the inversion too dry blue wave too moist cloud filled (and possibly convective/conditionally unstable)
Tephigrams a good wave day 6.Stable layer 1&2. Wind Profile 5.Dry air 3.Inversion 4.Stable layer
Tephigrams ANY QUESTIONS SO FAR?
Tephigrams the calculating curves Just what are we calculating?? Will there be any thermals? How high will they rise? Will it form a cumulus cloud or will the thermals be blue? What will the cloud base be? Where is the top of the cloud? Is there a risk of spread-out? Is there a risk of showers? (Will there be breaking wave?)
Tephigrams a few terms Dry air means air with no liquid water droplets (mist, fog, cloud). It does contain water vapour but the air is clear. Its temperature must be greater than its dewpoint. Saturated air contains microscopic liquid water droplets i.e. it is cloud! This air must be at its dewpoint temperature. A parcel of air is a hypothetical, small volume of air which does not mix or interact with the surrounding air. As this parcel of air rises it will expand and it will cool of its own accord. It does not gain or lose heat from/to the surrounding air and it does not mix with the surrounding air. This is called an adiabatic process. The cooling is caused by expansion alone. A thermal acts (almost) like a parcel of air.
Tephigrams the calculating curves Three calculating curves; 1. DALR dry adiabatic lapse rate curves used to calculate the temperature of a parcel of dry air (clear air which is above its dew point) as it rises through the atmosphere 2. SALR saturated adiabatic lapse rate curves used to calculate the temperature of a parcel of saturated air (air at its dew point which is cloud!) as it rises through the atmosphere 3. Mixing ratio lines (amount of water vapour in the air) used to calculate the dew point of a parcel of dry air as it rises through the atmosphere and indicates the point at which the SALR lines are to be used
Tephigrams the calculating curves 1. DALR dry adiabatic lapse rate curves (clear air curves)
DALR lines in use simple example Temp -40 C 21,000 Temp -10 C 10,000 Initial temp 20 C Surface
Tephigrams the calculating curves SALR saturated adiabatic lapse rate curves (cloud curves)
SALR lines Temp -14 C 21,000 10,000 Temp 6 C Initial temp 20 C Surface
Tephigram from RASP Air temp Dewpoint temp Parcel stops rising here Ignoring water/cloud! Temperature of parcel follows a DALR line
Tephigrams the calculating curves 3. Mixing ratio lines (dewpoint lines)
Tephigram mixing ratio Air temp Dewpoint temp Dewpoint of parcel at the surface is -5C and the mixing ratio is ~2.8g/kg Dewpoint of parcel at 10,000 is -10C
Tephigrams calculating curves These curves allow us to calculate the temperature and dew point of a parcel or thermal as it rises through the atmosphere The temperature and dew-point of a parcel or thermal rising through the atmosphere will follow these calculating curves not the data curves!
Tephigrams ANY QUESTIONS SO FAR?
Tephigram putting it together Cloudtop Cloudbase SALR line DALR line Mixing ratio line
Tephigram blue thermal Inversion/isothermal layer Mixing ratio line Thermal
Tephigrams - a good thermal day Lower air temperature profile follows dry (clear air) curves from the ground up (well mixed layer) 1. A stable layer / inversion at a reasonable height (top of thermal) 2. Cloudbase present at a reasonable height (not blue thermals) 3. Dry air above cloud level to minimise cumulus spread-out 4. Low wind speed (<15kts) within thermalling layer 5. No or thin upper cloud cover 6.
Tephigram a good thermal day Wind info Air temp Dewpoint temp 4.Dry air Height 2.Inversion 3. Cumulus cloud? 5. Low windspeed 1.Well-mixed layer Temp
Tephigrams why is stable air stable? Stable layer ?! ?!
Tephigrams well mixed layer Starting air temp line air temp cools Mechanical turbulence forces vertical mixing air temp warms
Tephigrams surface inversion Air temp Trigger temp 20C Surface inversion
Tephigrams superadiabatic layer Air temp Superadiabatic layer
Tephigrams - a good wave day 1. Wind speed > 10-15kts at hill tops (~3-4000 ) and gradually increasing with height Not too windy at cruising level (<50kts) 2. Wind direction relatively constant with height and from SW to N (at Portmoak) 3. Inversion or isothermal layer present at height of hill tops/ridges 4. Stable, relatively dry air above and below the inversion too dry blue wave too moist cloud filled (and possibly convective/conditionally unstable)
Tephigrams a good wave day 6.Stable layer 1&2. Wind Profile 5.Dry air 3.Inversion 4.Stable layer
Tephigrams - breaking wave Wind Wave Standing wave Breaking wave
Tephigrams ANY QUESTIONS?