Understanding Stresses and Analysis in Engineering
Stress is the internal resistance in a body when deformed, measured in Pascal (Pa) or Mega Pascal (MPa). Types of stress include shear, torsional, tensile, compressive, and bending stress. The relationship between stress and strain is crucial in material analysis, with materials categorized as ductile or brittle based on their behavior under load. Hooke's Law describes the linear relationship between stress and strain, with the modulus of elasticity indicating the material's stiffness.
Download Presentation

Please find below an Image/Link to download the presentation.
The content on the website is provided AS IS for your information and personal use only. It may not be sold, licensed, or shared on other websites without obtaining consent from the author. Download presentation by click this link. If you encounter any issues during the download, it is possible that the publisher has removed the file from their server.
E N D
Presentation Transcript
Stresses Analysis
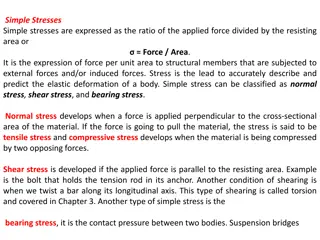
Stress: Stress is defined as the internal resistance set up by a body when it is deformed. It is measured in N/m2and this unit is specifically called Pascal (Pa). A bigger unit of stress is the mega Pascal (MPa). Stress Shear Stress Torsional Stress Tensile Stress Comperssive Stress Bending Stress 1.1.1 Tensile Stress and Tensile strain Tensile stress is a stress produced in members because of pull-type of load. It is denoted by ( t). Tensile strain is the ratio between increasing in length ( ?) to the total length (L). it is denoted by (??). F A F ? = ?? ? =? ?, ? ? = ? ? ? ? L
Where F is the force A is the crossingarea Example 1.1.1.2 Stress And Strain Realation As the axial load in Fig. 1 is gradually increased, the total elongation over the bar length is measured at each increment of load and this is continued until fracture of the specimen takes place. Knowing the original cross-sectional area of the test specimen, the normal stress, denoted by s, may be obtained for any value of the axial load by the use of the relation ?/ ? / ?, ? ? ?? ?? ?= = = where P denotes the axial load in Newton and A the original cross-sectional area. Having obtained numerous pairs of values of normal stress and normal strain , experimental data may be plotted with these quantities considered as ordinate and abscissa, respectively. This is the stress-strain curve or diagram of the material for this type of loading. Stress- strain diagrams assume widely differing forms for various materials. Figure 1(a) is the stress-strain diagram for a medium-carbon structural steel, Fig. 1(b) is for an alloy steel, and Fig. 1(c) is for hard steels and certain nonferrous alloys. For nonferrous alloys and cast iron the diagram has the form indicated in Fig. 1(d).
Figure (1) Ductile and Brittle Materials Metallic engineering materials are commonly classified as either ductile or brittle materials. A ductile material is one having a relatively large tensile strain up to the point of rupture (for example, structural steel or aluminum) whereas a brittle material has a relatively small strain up to this same point. An arbitrary strain of 0.05 mm/mm is frequently taken as the dividing line between these two classes of materials. Cast iron and concrete are examples of brittle materials. Hooke s Law For any material having a stress-strain curve of the form shown in Fig. 1-3(a), (b), or (c), it is evident that the relation between stress and strain is linear for comparatively small values of the strain. This linear relation between elongation and the axial force causing it is called Hooke s law. To describe this initial linear range of action of the material we may consequently write ?= ? ? where E denotes the slope of the straight-line portion OP of each of the curves in Figs.1(a), (b), and (c). The quantity E, i.e., the ratio of the unit stress to the unit strain, is the modulus of elasticity of the material in tension, or, as it is often called, Young s modulus. Values of E for various engineering materials are tabulated in handbooks. Since the unit strain is a pure number (being a ratio of two lengths) it is evident that E has the same units as does the stress, N/m2. For many common engineering materials the modulus of elasticity in compression is very nearly equal to that found in tension. Below the stress strain relationship
The stress-strain curve shown in Fig. 1(a) may be used to characterize several strength characters tics of the material. They are: Proportional Limit The ordinate of the point P is known as the proportional limit, i.e., the maximum stress that may be developed during a simple tension test such that the stress is a linear function of strain. For a material having the stress-strain curve shown in Fig. 1-3(d), there is no proportional limit. Elastic Limit The ordinate of a point almost coincident with P is known as the elastic limit, i.e., the maximum stress that may be developed during a simple tension test such that there is no permanent or residual deformation when the load is entirely removed. For many materials the numerical values of the elastic limit and the proportional limit are almost identical and the terms are sometimes used synonymously. In those cases where the distinction between the two values is evident, the elastic limit is almost always greater than the proportional limit. Elastic and Plastic Ranges
The region of the stress-strain curve extending from the origin to the proportional limit is called the elastic range. The region of the stress-strain curve extending from the proportional limit to the point of rupture is called the plastic range. Yield Point The ordinate of the point Y in Fig. 1(a), denoted by syp, at which there is an increase in strain with no increase in stress, is known as the yield point of the material. After loading has progressed to the point Y, yielding is said to take place. Some materials exhibit two points on the stress-strain curve at which there is an increase of strain without an increase of stress. These are called upper and lower yield points. Ultimate Strength or Tensile Strength The ordinate of the point U in Fig. 1(a), the maximum ordinate to the curve, is known either as the ultimate strength or the tensile strength of the material. Breaking Strength The ordinate of the point B in Fig. 1-3(a) is called the breaking strength of the material
Example Example


