Understanding Ratios, Proportional Relationships, and Slope in Math
Explore the concepts of ratios, proportional relationships, constant rate of change, and slope in mathematics. Learn how to find constant rates of change from tables and graphs, calculate slope using points on a line, and understand direct variation between two quantities. Dive into examples to grasp these fundamental mathematical ideas effectively.
- Math Concepts
- Ratios
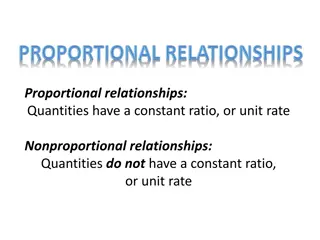
- Proportional Relationships
- Constant Rate of Change
- Slope Calculation
- Direct Variation
Download Presentation

Please find below an Image/Link to download the presentation.
The content on the website is provided AS IS for your information and personal use only. It may not be sold, licensed, or shared on other websites without obtaining consent from the author. Download presentation by click this link. If you encounter any issues during the download, it is possible that the publisher has removed the file from their server.
E N D
Presentation Transcript
Topic 1 part 2 Ratios and Proportional Relationships
Lesson 7.1.7 Constant Rate of Change A rate of change is a rate that describes how one quantity changes in relation to another. A constant rate of change is the rate of change of a linear relationship.
Example 1 Find the constant rate of change for the table. Students 5 10 15 20 # of Textbooks The change in the number of textbooks is 15. The change in the number of students is 5. 15 30 45 60 change in number of textbooks change in number of students=15 textbooks 5 students The number of textbooks increased by 15 for every 5 students. =3 textbooks 1 studentsWrite as a unit rate. So, the number of textbooks increases by 3 textbooks per student.
Example 2 The graph represents the number of T-shirtssold at a band concert. Use the graph to findthe constant rate of change in number per hour. To find the rate of change, pick any two points on the line,such as (8, 25) and (10, 35). change in number change in time (35 25) (10 8) =10 2 = or 5 T-shirts per hour
Lesson 8.3.2 Slope The slope m of a line passing through points (x1, y1) and (x2, y2) is the ratio of the difference in the y-coordinates to the corresponding difference in the x-coordinates. As an equation, the slope is given by ? =?2 ?1 ?2 ?1 , where x1 y1
Example 1 Find the slope of the line that passes through A(-1,-1) and B(2,3) ? =?2 ?1 ?2 ?1 Slope formula m = 3 ( 1) 2 ( 1) (x1, y1) = ( 1, 1), (x2, y2) = (2, 3) ? =4 3 Simplify. Check When going from left to right, the graph of the line slants upward. This is correct for a positive slope.
Example 2 Find the slope of the line that passes through C(1, 4) and D(3, 2). ? =?2 ?1 ?2 ?1 Slope formula m = 2 4 3 1 (x1, y1) = ( 1, 4), (x2, y2) = (3, 2) ? = 6 2 or 3 Simplify. Check When going from left to right, the graph of the line slants downward. This is correct for a negative slope.
Lesson 7.1.9 Direct Variation When two variable quantities have a constant ratio, their relationship is called a direct variation. The constant ratio is called the constant of proportionality.
Example 1 The time it takes Lucia to pick pints of blackberriesis shown in the graph. Determine the constant ofproportionality. Since the graph forms a line, the rate of change is constant. Use the graph to find the constant of proportionality. minutes number of pints=15 30 2 or 15 45 3 or 15 1 1 1 It takes 15 minutes for Lucia to pick 1 pint of blackberries.
Example 2 There are 12 trading cards in a package. Make a table and graph to show the number of cards in 1, 2, 3, and 4 packages. Is there a constant rate? a direct variation? Numbers of Packages 1 2 3 4 Number of Cards 12 24 36 48 Because there is a constant increase of 12 cards, there is a constant rate of change. The equation relating the variables is y = 12x, where y is the number of cards and x is the number of packages. This is a direct variation. The constant of proportionality is 12.
Lesson 8.3.3 Equations in y = mx form When the ratio of two variable quantities is constant, their relationship is called a direct variation. y = mx (m=the slope, the constant of proportionality)
Example 1 The distance that a bicycle travels varies directly with the number of rotations that its tires make. Determine the distance that the bicycle travels for each rotation. Since the graph of the data forms a line, the rate of change is constant. Use the graph to find the constant ratio. distance traveled # of rotations80 160 2or 80 240 3 or 80 320 4 or 80 1 1 1 1 The bicycle travels 80 inches for each rotation of the tires.
Example 2 The number of trading cards varies directly as the number of packages. If there are 84 cards in 7 packages, how many cards are in 12 packages? Let x = the number of packages and y = the total number of cards. y = mx Direct variation equation 84 = m(7) y = 84, x = 7 12 = m Simplify. y = 12x Substitute for m = 12. Use the equation to find y when x = 12. y = 12x y = 12(12) x = 12 y = 144 Multiply. There are 144 cards in 12 packages.
Lesson 8.3.4 Slope-Intercept Form Linear equations are often written in the form y = mx + b. This is called the slope- intercept form. When an equation is written in this form, m is the slope and b is the y-intercept.
Example 1 State the slope and the y-intercept of the graph of y = x 3. y = x 3 Write the original equation. y = 1x + ( 3) Write the equation in the form y = mx + b. y = mx + b m = 1, b = 3 The slope of the graph is 1, and the y-intercept is 3.
You can use the slope intercept form of an equation to graph the equation. Example 2 Graph y = 2x + 1 using the slope and y-intercept. Step 1 Find the slope and y-intercept. y = 2x + 1 slope = 2, y-intercept = 1 Step 2 Graph the y-intercept 1. Step 3Write the slope 2 as 2 1. Use it to locate a second point on the line. change in y : up 2 units change in x : right 1 units m = 2 1 Step 4 Draw a line through the two points.


