Understanding Pie Charts with Fractions, Decimals, and Percentages
Explore pie charts through shaded fractions to decimals and percentages. Answer questions about people's color choices, fractions, and representations in pie charts. Learn about different representations and how they relate to percentages, decimals, and fractions.
Download Presentation

Please find below an Image/Link to download the presentation.
The content on the website is provided AS IS for your information and personal use only. It may not be sold, licensed, or shared on other websites without obtaining consent from the author. Download presentation by click this link. If you encounter any issues during the download, it is possible that the publisher has removed the file from their server.
E N D
Presentation Transcript
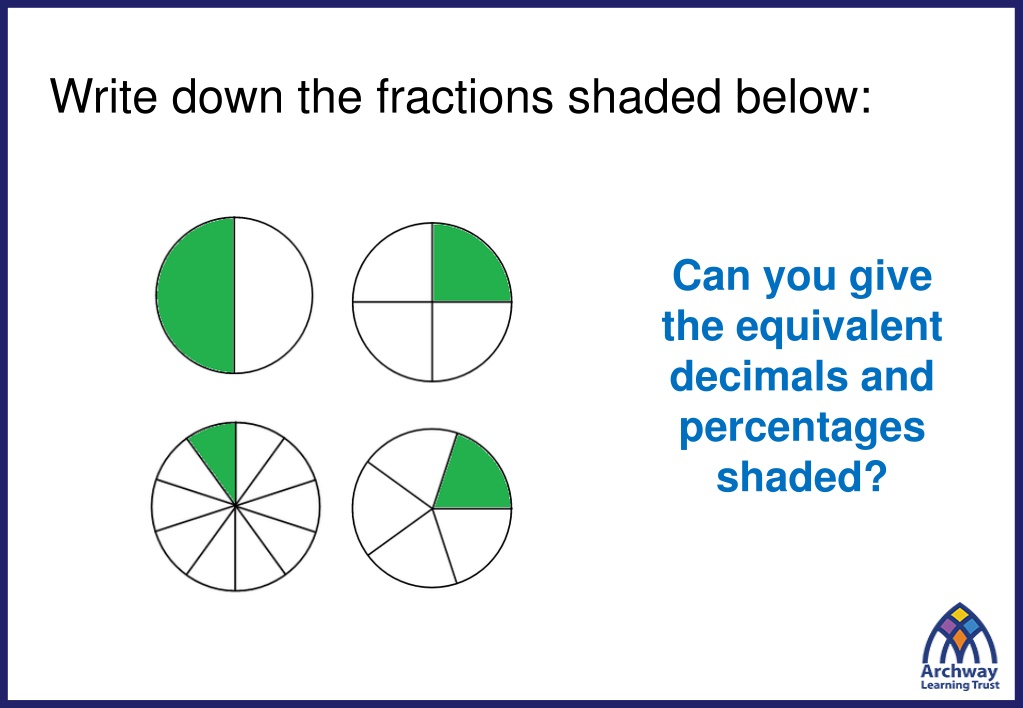
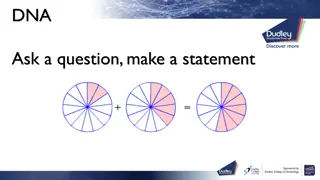
Write down the fractions shaded below: Can you give the equivalent decimals and percentages shaded?
Pie charts bingo! Draw a 3 x 3 grid and write in 9 of the numbers below: ? ? ? ? 0% 7 ? 50% 11 12 ? ? ? 16 75% 0.5 27 44 100% 33.3%
Pie Charts Bingo What percentage of people chose purple? 50%
Pie Charts Bingo What fraction of people chose green? ? ?
Pie Charts Bingo What percentage of people chose purple? 100%
Pie Charts Bingo The pie chart represents 28 people. How many chose red? 7
Pie Charts Bingo What fraction of people chose black? ? ?
Pie Charts Bingo What percentage of people chose pink? 0%
Pie Charts Bingo What decimal does the yellow part represent? 0.5
Pie Charts Bingo What fraction of people chose black? ? ?
Pie Charts Bingo How many people are represented by 100% of the pie chart? 16 2 people 2 people 2 people
Pie Charts Bingo What fraction of people chose red? ? ?
Pie Charts Bingo The pie chart represents 22 people. How many chose grey? 11
Pie Charts Bingo What percentage of people chose red? 33.3%
Pie Charts Bingo How many people are represented by the pie chart? 9 people27 9 people 9 people
Pie Charts Bingo What percentage of people chose grey? 75%
Pie Charts Bingo If 25% of people chose purple and we know 11 people chose purple, how many people are represented by the pie chart? 44
Title: Pie Charts Today we are going to be linking our previous work on fractions, decimals and percentages to pie charts. Pie charts show the proportions of a survey or data set.
Discuss: True or False? There are more 15 year old boys than girls. Girls Boys 18 year olds 18 year olds 15 year olds 15 year olds 17 year olds 17 year olds 16 year olds 16 year olds
Worked Example The pie chart shows the favourite primary colours for a group of students. What percentage of students favourite colour is not yellow? Yellow 3 5 Blue 1 5 Red Red 4 5 not Yellow Blue 80% not Yellow 1st Qtr 2nd Qtr 3rd Qtr
On your whiteboards 30% 35% ??=? ? ? How many children chose PE? We don t know as no information is given about numbers, just proportions
Challenge Red = 15% 90% 10-15%
