Understanding Long-Term Services and Supports (LTSS): Overview and Projections
LTSS encompasses a variety of paid and unpaid medical and personal care services to assist with daily living activities for individuals with aging, chronic illness, or disability. Most Americans underestimate the need for LTSS, with about 58% of those turning 65 today likely to require such services. The average future LTSS cost is estimated at $137,800, emphasizing the importance of financial planning. Family caregivers play a significant role in providing care. Various LTSS payment options include nursing home care, assisted living, home care, and adult day services, each with associated costs.
Download Presentation

Please find below an Image/Link to download the presentation.
The content on the website is provided AS IS for your information and personal use only. It may not be sold, licensed, or shared on other websites without obtaining consent from the author. Download presentation by click this link. If you encounter any issues during the download, it is possible that the publisher has removed the file from their server.
E N D
Presentation Transcript
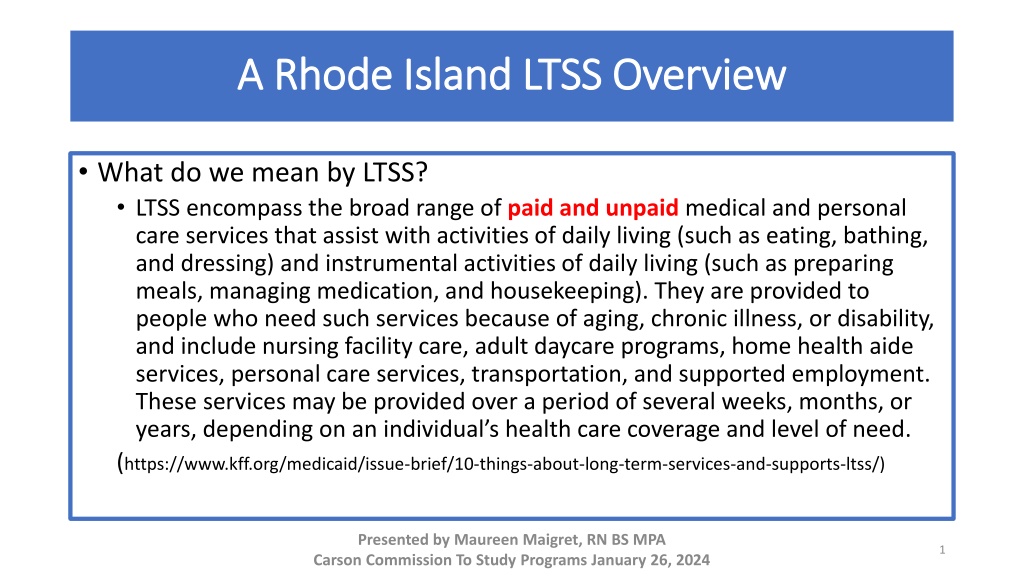
A Rhode Island LTSS Overview A Rhode Island LTSS Overview What do we mean by LTSS? LTSS encompass the broad range of paid and unpaid medical and personal care services that assist with activities of daily living (such as eating, bathing, and dressing) and instrumental activities of daily living (such as preparing meals, managing medication, and housekeeping). They are provided to people who need such services because of aging, chronic illness, or disability, and include nursing facility care, adult daycare programs, home health aide services, personal care services, transportation, and supported employment. These services may be provided over a period of several weeks, months, or years, depending on an individual s health care coverage and level of need. (https://www.kff.org/medicaid/issue-brief/10-things-about-long-term-services-and-supports-ltss/) Presented by Maureen Maigret, RN BS MPA Carson Commission To Study Programs January 26, 2024 1
Projections on LTSS Need Projections on LTSS Need HIGHLIGHTS Most Americans underestimate risk of developing a disability and needing LTSS Estimate 58% of Americans turning 65 today will develop disability serious enough to need LTSS About 20% will have disability for more than 5 years Average future LTSS cost incurred: $137,800 (need to set aside $80,200 today ) Including residential care, families will pay more than half out-of-pocket with rest from public sources or private insurance Almost 20% of persons will spend at least $100,000 for future LTSS Family caregivers provide significant care: value approximately equals expected cost of paid LTSS Source: 2020 ASPE RESEARCH BRIEF, Long-Term Care Services and Supports for Older Americans: Risks and Financing, @ https://aspe.hhs.gov/reports/long-term-services- supports-older-americans-risks-financing-2020-research-brief-0 ss 2
How Do LTSS Get Paid How Do LTSS Get Paid 3
$$ RILong Term Care Cost $$ Month year Nursing Home Semi-private $9,429/$113,150 Assisted Living (private, 1BR) Home Care (40 hrs/week x 52 weeks) Adult Day Services (5 days/week) Source: Genworth Cost of Care Report 2021 Median RI Costs $6,826/$81,915 $5416/$65,992 $1,798/$21,580 RI 4
RI Long Term Services & Supports Eleanor Slater Hospital Patients (BHDDH average for 2023) 40 155 (excludes forensic unit) DD Licensed Service Providers (as of 12.28.2023, BHDDH website) Nursing Facilities licensed (RI DOH 7/17/2023) Nursing Facility Beds (RI DOH 7/17/2023) (7,059 users 2022 EOHHS LTSS SFY2022 LTSS Performance Report) Assisted Living Residences Limited Health Services Special Care Units (1319 beds) (RI DOH 12/28/2023) Assisted Living Units (804 residents all ages in AL on Medicaid SFY 2022:EOHHS LTSS Performance Report) Adult Day Programs (12/28.23) ( 955 all ages on Medicaid/OHA in SFY 2022: EOHHS LTSS Performance Report) Home Nursing Care Providers (Provide skilled services&general home care services. RI DOH (12.28.2023) 79 Shared Living Programs (non DD) 2 394 Shared Living Participants (382 persons served in FY 2022 SFY 2022:EOHHS LTSS Performance Report) 8,584 63 14 34 Personal Choice PCAs & Independent Providers merged # Persons served in 2023 (EOHHS) 1,245 Preventive Services (up to 6 hours of homemaker/CNA s 468 persons all ages used SFY2022 PACE participants (Program of All Inclusive Care for Elderly) (as of 1.1.2024) 4,951 (RIDOH 12.2023) 31 418 62 1,131 213 295 Home Delivered Meals (MOW) Feb. 2023 approx. daily meals delivered LTSS Meals: 213 38 OHA Respite Program (2023 served) Unpaid Family/Friend Caregivers 121,000 caregivers; 113 Mil Hrs; $2.1Bil value (value of $16.59 hr-AARP, Valuing the Invaluable. March 2023 Home Care Providers (12.28.23) (do not provide skilled care) (4761 Medicaid/OHA home care in 2022) 5
RI LTSS: A Look Back RI LTSS: A Look Back - - FY2002 FY2002 FY 2024 FY 2024 Licensed Long Term Care Providers FY2002 Nursing Facilities Number of Beds Occupancy Rate 88.9% FY2023 103 10,262 79 8,584 (1678 decrease; -16% beds) 86.8% (RIHCA) Assisted Living Residences Number of Units 70 3,372 63 4,951 (1579 increase; +47%) Home Nursing Providers 50 62 Home Care Providers 15 38 Adult Day Service Providers 19 31 2002 Data from RI LONG TERM CARE SPENDING: WHERE TO THE $$$$ GO?. Long Term Care Coordinating Council Report. Feb. 2003 6
How Does RI Compare on LTSS Measures How Does RI Compare on LTSS Measures Long- -Term Services and Supports State Scorecard 2023 Edition Term Services and Supports State Scorecard 2023 Edition Overall ranked 12 Overall ranked 12 Long 5 ELEMENTS 5 ELEMENTS Affordability & Access (17) Choice of Setting & Provider (10) Safety & Quality (23) Support for Caregivers (20) Community Integration (15) https://ltsschoices.aarp.org/sites/default/files/documents/doi/ltss-scorecard-2023-innovation-and-opportunity.doi.10.26419-2Fppi.00203.001.pdf AARP Foundation The Common wealth Fund The John Hartford Foundation The Scan Foundation 8
