Understanding Free-Falling Bodies in Physics
In the absence of air resistance, all bodies fall vertically with the same acceleration called gravity (g). This ideal motion, known as free-fall, allows kinematic equations to be used for calculations. Discover more about acceleration due to gravity, free-fall concepts, and practical scenarios like falling stones and coin tosses in physics.
Download Presentation

Please find below an Image/Link to download the presentation.
The content on the website is provided AS IS for your information and personal use only. It may not be sold, licensed, or shared on other websites without obtaining consent from the author. Download presentation by click this link. If you encounter any issues during the download, it is possible that the publisher has removed the file from their server.
E N D
Presentation Transcript
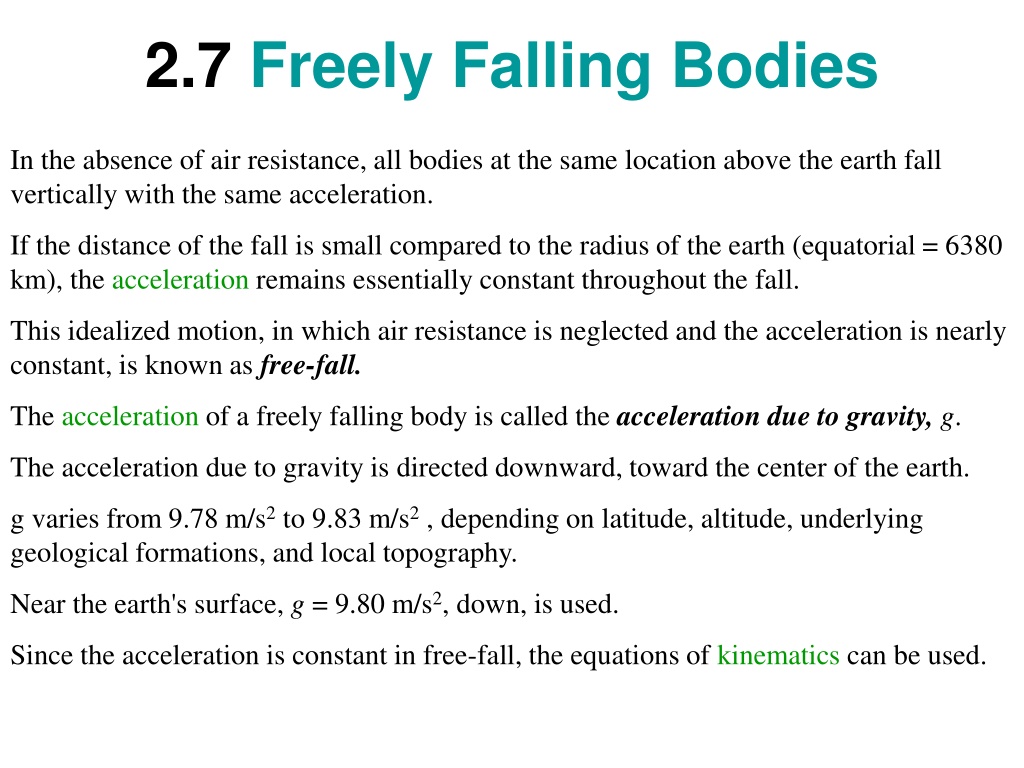
2.7 Freely Falling Bodies In the absence of air resistance, all bodies at the same location above the earth fall vertically with the same acceleration. If the distance of the fall is small compared to the radius of the earth (equatorial = 6380 km), the acceleration remains essentially constant throughout the fall. This idealized motion, in which air resistance is neglected and the acceleration is nearly constant, is known as free-fall. The acceleration of a freely falling body is called the acceleration due to gravity,g. The acceleration due to gravity is directed downward, toward the center of the earth. g varies from 9.78 m/s2 to 9.83 m/s2 , depending on latitude, altitude, underlying geological formations, and local topography. Near the earth's surface, g = 9.80 m/s2, down, is used. Since the acceleration is constant in free-fall, the equations of kinematics can be used.
Heavy and light objects fall at the same rate https://www.youtube.com/watch?v=5C5_dOEyAfk
A Falling Stone A stone is dropped from rest from the top of a tall building, as the figure indicates. After 3.00 s of free-fall, a. what is the velocity v of the stone? b. what is the displacement y of the stone?
Coin Toss A football game customarily begins with a coin toss to determine who kicks off. The referee tosses the coin up with an initial speed of 6.00 m/s. In the absence of air resistance, how high does the coin go above its point of release?
What is the velocity and acceleration at the maximum height? 20. What is the acceleration of a rock thrown straight upward on the way up? At the top of its flight? On the way down?
Chapter 2, Problem 57 57. A coin is dropped from a hot-air balloon that is 300 m above the ground and rising at 10.0 m/s upward. For the coin, find (a) the maximum height reached, (b) its position and velocity 4.00 s after being released, and (c) the time before it hits the ground.
2.8 Graphical Analysis of Motion First we will graphically look at a motion where a person walks at a constant velocity along a straight-line path. Can you plot the position, x (m) versus time, t (s) graph?
Position VS. Time graph What is the slope of the position VS. time graph? Rise X = = = Slope Velocity Run t
Position VS. Time graph The position VS. time graph for an object moving with constant velocity is shown below. a. How will you modify the graph if the object accelerates. b. How will you modify the graph if the object decelerates.
A Bicycle Trip A bicyclist maintains a constant velocity on the outgoing leg of a journey, zero velocity while stopped for lunch, and another constant velocity on the way back.
Velocity versus Time graph A car is moving along a straight-line path starting from rest at a constant acceleration. Once the car reaches a velocity of 45 MPH, that velocity is maintained for a while. Finally the brakes are applied with a constant deceleration and the car comes to rest. Can you plot Velocity VS. Time for the car?
Velocity VS. Time The slope of the velocity versus time graph is the acceleration. Rise Slope = V = = Accelerati on Run t The area under the velocity versus time graph is the displacement.
Chapter 2, Problem 65 65. A graph of v(t) is shown for a world-class track sprinter in a 100-m race. (See Figure 2.67). (a) What is his average velocity for the first 4 s? (b) What is his instantaneous velocity at t = 5 s ? (c) What is his average acceleration between 0 and 4 s? (d) What is his time for the race?
A snowmobile moves according to the velocity-time graph shown in the drawing. a. What is the snowmobile s average acceleration during each of the segments A, B, and C? b. How far it travels during each of the segments A, B, and C?
