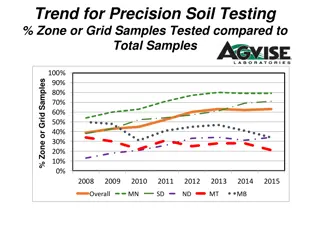
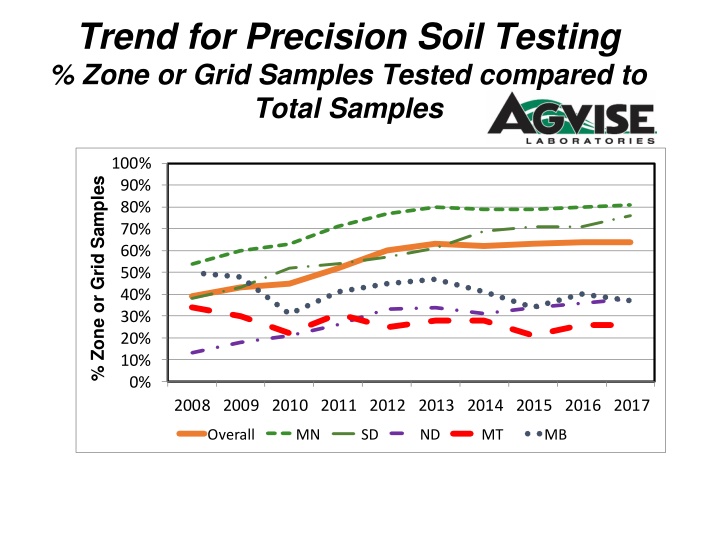
Trend for Precision Soil Testing Zones
Explore the evolution of precision soil testing practices over the years, focusing on zone or grid samples tested compared to total samples. Dive into the data on zone or grid samples tested compared to conventional whole field composite samples in 2017. Delve into the insights provided by AGVISE Laboratories on grid or zone samples tested versus conventional whole field composite samples from 1997 to 2017. Examine median soil nitrate values following wheat and fallow in 2017, along with soil nitrate variability between fields in Montana. Lastly, discover the percentage of soil samples with phosphorus levels below 10 ppm in fall 2017 samples.

Download Presentation

Please find below an Image/Link to download the presentation.
The content on the website is provided AS IS for your information and personal use only. It may not be sold, licensed, or shared on other websites without obtaining consent from the author.If you encounter any issues during the download, it is possible that the publisher has removed the file from their server.
You are allowed to download the files provided on this website for personal or commercial use, subject to the condition that they are used lawfully. All files are the property of their respective owners.
The content on the website is provided AS IS for your information and personal use only. It may not be sold, licensed, or shared on other websites without obtaining consent from the author.
E N D
Presentation Transcript
Trend for Precision Soil Testing % Zone or Grid Samples Tested compared to Total Samples 100% % Zone or Grid Samples 90% 80% 70% 60% 50% 40% 30% 20% 10% 0% 2008 2009 2010 2011 2012 2013 2014 2015 2016 2017 Overall MN SD ND MT MB
%Zone or Grid Samples Tested Compared to Conventional Whole Field Composite Samples in 2017 100% 90% 81% 76% 80% 70% 64% 60% 50% 38% 37% 40% 26% 30% 20% 10% 0% MN ND SD MT MB Overall
AGVISE Laboratories %Zone or Grid Samples Northwood laboratory 1997 - 2017 70% 60% % Grid or Zone Samples Tested Compared To Conventional Whole Field Composite Samples Tested 50% 39%40%39%41%41%41% 40% 26%28%31%33% 30% 22% 18% 20% 15%16% 14%15% 15% 11% 11% 11% 8% 10% 0% 1997 1998 1999 2000 2001 2002 2003 2004 2005 2006 2007 2008 2009 2010 2011 2012 2013 2014 2015 2016 2017
Median Soil Nitrate following Wheat in 2017 Fall 2017 samples (lb/a 0-24 samples) 37 53 47 46 28 Median Value Reported based on 50 samples minimum
Soil Nitrate Variability Between Fields Following WHEAT in Montana 2016 & 2017
Median Soil Nitrate following Wheat in 2017 MB Fall 2017 Samples 24 (lb/a 0-24 samples) 28 35 45 34 25 29 47 40 59 32 25 ND 43 84 35 26 80 63 40 MN 62 29 SD 61 50
Median Soil Nitrate following Fallow in 2017 Fall 2017 samples (lb/a 0-24 samples) 46 42 44 Value Reported based on 50 samples minimum
Soil Nitrate Variability Between Fields Following Fallow in Montana 2016 & 2017
% Soil Samples with Phosphorus less than 10 ppm Fall 2017 samples (0-6 ) (Olsen P test) 37% 49% 31% 61% 46% 16% Value Reported based on 100 samples minimum
% Soil Samples with Phosphorus less than 10 ppm Fall 2017 samples (0-6 samples) (Olsen P test) MB 42% 39% 49% 48% 27% 65% 29% 29% 21% 66%64% 65% 52% 57% 67% ND 47% 45% 61% 48% 56% 36% 58% MN 36% 50% 38% SD 31% 39% 33% 34%
% Soil Samples with Potassium less than 150 ppm Fall 2017 samples (0-6 ) 1% 4% 3% 25% 10% 33% Value Reported based on 100 samples minimum
% Soil Samples with Potassium less than 150 ppm MB Fall 2017 samples (0-6 samples) 30% 21% 33% 28% 21% 10% 16% 14% 29% 4% 7% 3% 19% 79% 39% ND 9% 23% 60% 11% 46% 7% 43% 5% 6% 26% MN 28% SD 29% 1% 5% 25% 35%
% Soil Samples with Zinc less than 1.0 ppm Fall 2017 samples (0-6 ) 87% 81% 78% 66% 54% 72% Value Reported based on 100 samples minimum
% Soil Samples with Zinc less than 1.0 ppm MB Fall 2017 samples (0-6 samples) 51% 62% 59% 66% 35% 87% 48% 43% 27% 69% 89% 81% 41% 68% 47% ND 51% 70% 17% 83% 53 52% 17% 77% 43% MN 52% 24% SD 13% 57% 41% 30% 21%
% Soil Samples with Sulfur less than 15 lb/a Fall 2017 samples (0-6 ) 54% 34% 32% 15% 21% Value Reported based on 100 samples minimum
% Soil Samples with Sulfur less than 15 lb/a MB Fall 2017 samples (0-6 samples) 2% 5% 5% 2% 5% 9% 4% 3% 36%11% 7% 6% 19% 7% ND 14% 77% 13% 20% 27% 29% 80% 55% MN 48% 32% 73% SD 89%79% 49% 40% 59%
% Soil Samples with Copper less than 0.5 ppm Fall 2017 samples (0-6 ) 1% 6% 2% 11% 4% 1% Value Reported based on 100 samples minimum
% Soil Samples with Copper less than 0.5 ppm MB Fall 2017 samples (0-6 samples) 11% 4% 28% 8% 29% 17% 15% 19% 4% 3% 16% 5% 14% 37% 49% ND 11% 52% 12% 33% 15% 12% 36% 24% 12% MN 12% 10% SD 3% 1% 6% 3%
% Soil Samples with Boron less than 0.4 ppm Fall 2017 samples (0-6 ) 21% 11% 3% 4% 3% 1% Value Reported based on 100 samples minimum
% Soil Samples with Boron less than 0.4 ppm MB Fall 2017 samples (0-6 samples) 1% 0% 5% 0% 3% 1% 7% 1% 2% 3% 3% 9% 3% 23% 9% ND 3% 88% 13% 25% 3% 11% 51% 16% 16% 17% MN 21% SD 9% 43%19% 9% 18%
% Soil Samples with Chloride less than 40 lb/a Fall 2017 samples (0-6 ) 84% 72% 68% 50% 61% 73% Value Reported based on 100 sample minimum
% Soil Samples with Chloride less than 40 lb/a MB Fall 2017 Samples (0-24 samples) 52% 34% 26% 47% 10% 38% 37% 23% 21% 81%60% 46% 33% 21% ND 53% 78% 40% 54% 79% 90% 83% 41% MN 67% 70% SD 54% 78% 75%
% Soil Samples with Carbonate greater than 5.0% Fall 2017 samples (0-6 ) 4% 15% 25% 36% 13% Value Reported based on 100 samples minimum
% Soil Samples with Carbonate greater than 5.0% MB Fall 2017 samples (0-6 samples) 43% 59% 32% 21% 35% 10% 15% 14% 36% 16% 13% 4% 31% 34% 5% ND 6% 10% 10% 40% 6% 10% 0% 3% MN 14% 26% SD 17% 8% 2% 1%
% Soil Samples with Salts greater than 1.0 mmhos/cm Fall 2017 samples (0-6 ) 2% 3% 4% 8% 10% 6% Value Reported based on 100 samples minimum
% Soil Samples with Salts greater than 1.0 MB Fall 2017 Samples (0-6 samples) 15% 24% 17% 21% 37% 17% 13% 23% 19% 5% 26% 11% 43% 20% 7% ND 12% 5% 4% 19% 11% 3% 4% 16% MN 6% 3% SD 1% 1% 3% 8% 5%
% Soil Samples with soil pH greater than 7.3 Fall 2017 samples (0-6 ) 69% 75% 74% 87% 89% 84% Value Reported based on 100 samples minimum
% Soil Samples with Soil pH greater than 7.3 MB Fall 2017 samples (0-6 samples) 72% 97% 79% 85% 89% 77% 53% 74% 90% 72%55% 82% 82% 59% 98% ND 51% 10% 71% 46% 83% 31% 49% 21% 30% MN 43% 58% SD 17% 30% 21% 30% 23%
% Soil Samples with soil pH less than 6.0 Fall 2017 samples (0-6 ) 5% 4% 3% 3% 1% 2% Value Reported based on 100 samples minimum
% Soil Samples with Subsoil pH less than 7.0 Fall 2017 samples (0-6 ) 3% 2% 1% 1% 1% 10% Value Reported based on 100 samples minimum
% Soil Samples with Soil pH less than 6.0 MB Fall 2017 samples (0-6 samples) 1% 0% 3% 1% 4% 1% 18% 7% 1% 1% 1% 5% 2% 9% 1% ND 4% 29% 2% 12% 3% 13% 16% 11% 15% 11% MN 8% 15% SD 14% 40% 32% 13% 8%
% Soil Samples with %OM less than 3.0% Fall 2017 samples (0-6 ) 95% 76% 67% 86% 75% Value Reported based on 100 samples minimum
% Soil Samples with %OM less than 3.0% MB Fall 2017 Samples (0-6 samples) 7% 6% 21% 3% 20% 29% 30% 17% 9% 74%40% 30% 25% 26% 43% ND 29% 58% 76% 25% 26% 30% 25% 50% MN 26% 13% 11% SD 20% 28% 4% 24% 6%
Zip codes for Montana 599 595 592 594 598 596 593 590-591 597