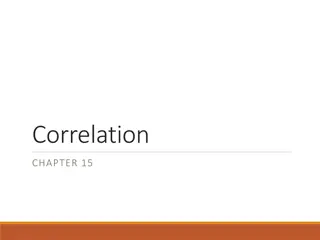
Towards Study of 2-Particle Pt Correlations
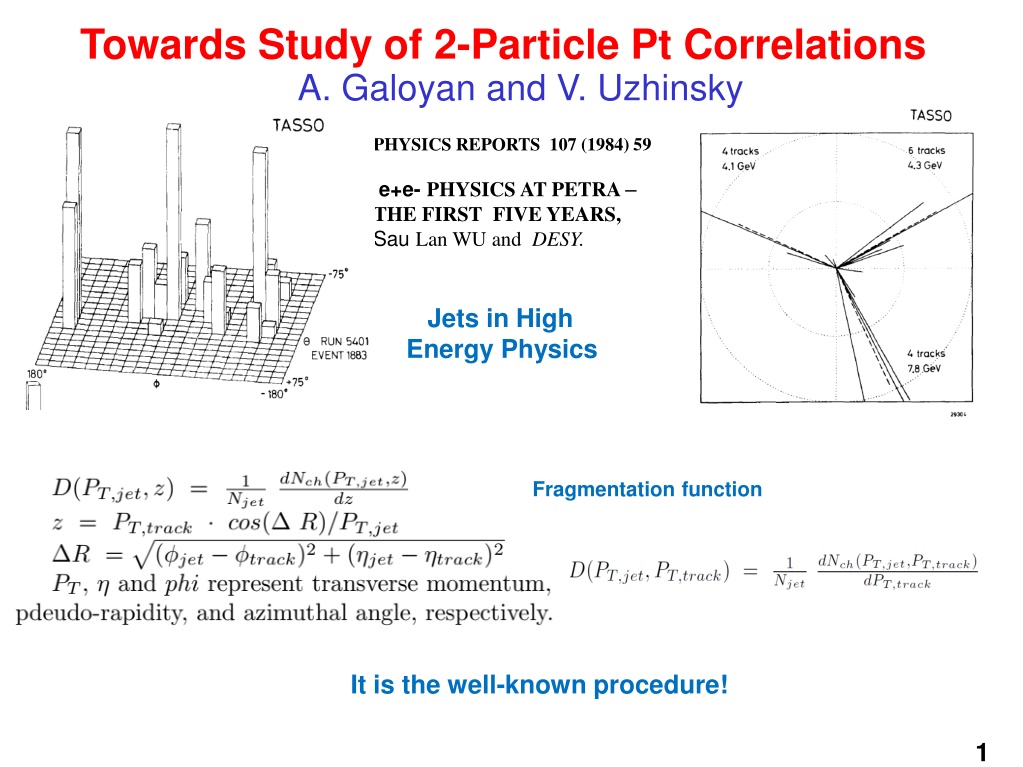
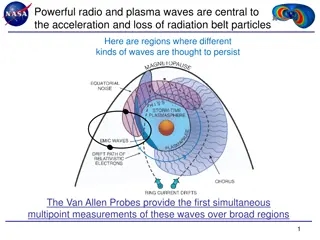
PHYSICS REPORTS 107 (1984) 59
e
+
e
-
P
H
Y
S
I
C
S
A
T
P
E
T
R
A
–
THE FIRST
FIVE YEARS,
Sau
Lan WU and
DESY.
T
o
w
a
r
d
s
S
t
u
d
y
o
f
2
-
P
a
r
t
i
c
l
e
P
t
C
o
r
r
e
l
a
t
i
o
n
s
A
.
G
a
l
o
y
a
n
a
n
d
V
.
U
z
h
i
n
s
k
y
J
e
t
s
i
n
H
i
g
h
E
n
e
r
g
y
P
h
y
s
i
c
s
F
r
a
g
m
e
n
t
a
t
i
o
n
f
u
n
c
t
i
o
n
I
t
i
s
t
h
e
w
e
l
l
-
k
n
o
w
n
p
r
o
c
e
d
u
r
e
!
1
1
9
A
u
g
.
2
0
2
0
a
r
X
i
v
:
2
0
0
8
.
0
8
6
3
1
[
n
u
c
l
-
e
x
p
]
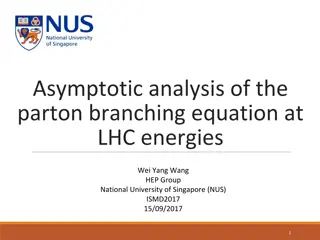
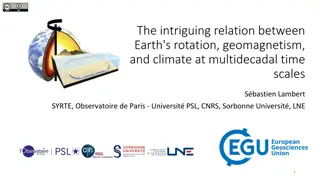
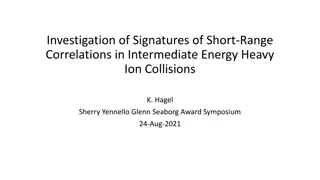
Measurement of semi-inclusive jet fragmentation
functions in Au+Au collisions at
Sqrt(S
NN)
=
200
GeV in STAR,
Saehanseul Oh (for the STAR Collaboration)
In-medium modifications of
fragmentation functions have
been previously reported by
LHC collaborations for
inclusive jet populations
[
4
,
5
].
[
[4] M. Aaboud
et al.
,
“Measurement of jet
fragmentation in Pb+Pb and pp
collisions at
sqrt(
sNN) = 2:76 TeV
with the ATLAS detector at the
LHC”, Eur. Phys. J. C
77
, no.6, 379
(2017).
[5] S. Chatrchyan
et al.
,
“Measurement of jet fragmen-
tation into charged particles in pp
and PbPb collisions at
sqrt(
sNN )=
2:76 TeV”,
J
H
E
P
1
0
,
0
8
7
(
2
0
1
2
)
.
E
x
a
m
p
l
e
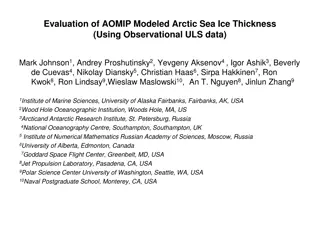
Figure 1:
Semi-inclusive jet fragmentation functions measured in 40–60% Au+Au
collisions for three pT;jet ranges (closed markers), compared to those calculated
by PYTHIA 8 for pp collisions (dashed lines). Measured distributions are
corrected for detector effects and uncorrelated background effects.
2
1
1
A
u
g
.
2
0
2
0
2
0
0
8
.
0
4
1
8
7
[
h
e
p
-
e
x
p
]
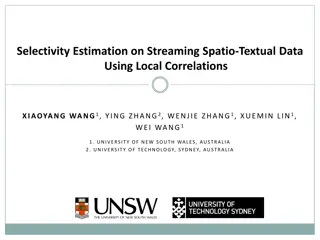
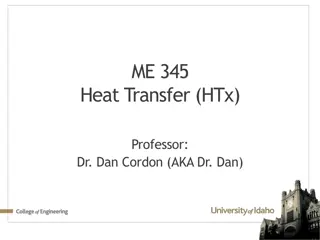
Measurement of two-particle correlations in hadronic e+e− collisions at Belle,
A. Abdesselam et.al.
O
t
h
e
r
e
x
p
.
m
e
t
h
o
d
–
a
z
i
m
u
t
h
a
l
c
o
r
r
e
l
a
t
i
o
n
s
T
he “ridge signal”, is a phenomenon widely observed in high multiplicity proton-proton,
proton-ion and deutron-ion collisions, which is not yet fully understood.
Two-particle correlation functions
for beam (left) and thrust (right)
axis analyses with offline
multiplicity N
offline Trk
≥ 12.
3
3
1
O
c
t
.
2
0
1
9
1
9
1
0
.
1
4
4
0
3
[
n
u
c
l
-
e
x
]
Azimuthal correlations of prompt D mesons with charged particles in pp and p–Pb collisions at
psNN = 5:02 TeV
ALICE Collaboration
O
t
h
e
r
e
x
p
.
m
e
t
h
o
d
–
a
z
i
m
u
t
h
a
l
c
o
r
r
e
l
a
t
i
o
n
s
4
2
-
P
a
r
t
i
c
l
e
P
t
C
o
r
r
e
l
a
t
i
o
n
s
W
h
a
t
t
o
d
o
i
f
t
h
e
r
e
i
s
N
o
J
e
t
?
5
1.
We calculated 1000000 PP-events at √S=25 GeV
using
FTF
and
Pythia
generators in
SPDRoot
P
t
-
C
o
r
r
e
l
a
t
i
o
n
:
c
a
l
c
u
l
a
t
i
o
n
m
e
t
h
o
d
2. We selected events with
Λ
–hyperons, and calculated
Cos(φ_
Λ
) = Px_
Λ
/ Pt_
Λ
Sin( φ_
Λ
) = Py_
Λ
/ Pt_
Λ
3. For these events we transformed Px and Py momenta of
particles associated with
Λ
–hyperon in the new rotated
coordinate system.
P
x
’
=
P
x
*
C
o
s
(
φ
_
Λ
)
+
P
y
*
S
i
n
(
φ
_
Λ
)
P
y
’
=
-
P
x
*
S
i
n
(
φ
_
Λ
)
+
P
y
*
C
o
s
(
φ
_
Λ
)
(
I
t
i
s
o
b
v
i
o
u
s
l
y
,
t
h
a
t
f
o
r
Λ
–
h
y
p
e
r
o
n
P
x
’
=
P
t
;
P
y
’
=
0
)
4
.
W
e
p
e
r
f
o
r
m
e
d
a
n
a
l
y
s
i
s
o
f
t
r
a
n
s
f
o
r
m
e
d
P
x
’
a
n
d
P
y
’
2
o
f
p
a
r
t
i
c
l
e
s
produced with
Λ
–hyperons.
6
Comparison of Px’ of K0-mesons and Λ-bar hyperons
associated with Λ hyperon in PP- events calculated by FTF
<Px’_K0> = -110 MeV
/с
, N_K0 = 66070
<Px’_Λ> = 709 MeV
/с
, N_ Λ = 89380
<Px’_Λ
bar> = -160 MeV
/с
, N_
Λbar
= 9661
7
Px’ of particles associated with Λ hyperons
in PP-events calculated by FTF
<Px’_K0> = -110 MeV
/с
,
<Px’_K+>=-117 MeV
/с
,
<Px’_K- > = -69 MeV
/с
<Px’_
π
0> = -27 MeV
/с
, <Px’_
π
+>=-38.5 MeV
/с
<Px’_
π
- > = -38
MeV
/с
<Px’_Λ> = 709 MeV/c
8
Correlations of mean Px’ of Λ-bar hyperons, K and
π
mesons with
Λ hyperon Px’ in PP-events calculated by FTF
9
Correlations of mean Py’
2
of Λ-bar hyperons, K and
π
mesons
with Λ hyperon Px’ in PP-events calculated by FTF
<
P
y
’
2
Λ
b
a
r
>
=
2
3
0
(
M
e
V
/
c
)
2
<
P
y
’
2
K
0
>
=
1
6
0
(
M
e
V
/
c
)
2
<
P
y
’
2
π
0
>
=
8
6
(
M
e
V
/
c
)
2
1
0
Px’ of particles associated with Λ hyperons
in PP- events calculated by Pythia
<Px’_K0> = -70 MeV/c
,
<Px’_K+>=-67 MeV/c
,
<Px’_K- > = -77 MeV/c
<Px’_
π
0> = -29.5 MeV/c, <Px’_
π
+>=-38 MeV/c, <Px’_
π
- > = -22 MeV/c
<Px’_Λ> = 723 MeV/c, N_ Λ=183551;
<Px’_
Λ
bar>=-39 MeV/c, N_
Λ
bar=17243
We calculated 1000000 PP-events at √S=25 GeV using
Pythia
in SPDRoot
1
1
C
o
r
r
e
l
a
t
i
o
n
s
o
f
m
e
a
n
P
x
’
,
P
y
’
2
o
f
Λ
-
b
a
r
h
y
p
e
r
o
n
s
,
K
a
n
d
π
m
e
s
o
n
s
w
i
t
h
Λ
h
y
p
e
r
o
n
P
x
’
i
n
P
P
-
e
v
e
n
t
s
c
a
l
c
u
l
a
t
e
d
b
y
P
Y
T
H
I
A
<
P
y
’
2
Λ
b
a
r
>
=
1
9
1
(
M
e
V
/
c
)
2
<
P
y
’
2
K
0
>
=
1
5
4
(
M
e
V
/
c
)
2
<
P
y
’
2
π
0
>
=
8
3
(
M
e
V
/
c
)
2
1
2
C
o
m
p
a
r
i
s
o
n
o
f
c
o
r
r
e
l
a
t
i
o
n
s
o
f
m
e
a
n
P
x
’
o
f
Λ
-
b
a
r
h
y
p
e
r
o
n
s
a
n
d
K
-
m
e
s
o
n
s
w
i
t
h
Λ
h
y
p
e
r
o
n
P
x
’
i
n
e
v
e
n
t
s
c
a
l
c
u
l
a
t
e
d
b
y
P
Y
T
H
I
A
a
n
d
F
T
F
1
3
C
o
m
p
a
r
i
s
o
n
o
f
c
o
r
r
e
l
a
t
i
o
n
s
o
f
m
e
a
n
P
y
’
2
o
f
Λ
-
b
a
r
h
y
p
e
r
o
n
s
a
n
d
K
-
m
e
s
o
n
s
w
i
t
h
Λ
h
y
p
e
r
o
n
P
x
’
i
n
e
v
e
n
t
s
c
a
l
c
u
l
a
t
e
d
b
y
P
Y
T
H
I
A
a
n
d
F
T
F
1
4
C
o
m
p
a
r
i
s
o
n
o
f
c
o
r
r
e
l
a
t
i
o
n
s
o
f
m
e
a
n
P
x
’
a
n
d
P
y
’
2
o
f
π
-
m
e
s
o
n
s
w
i
t
h
Λ
h
y
p
e
r
o
n
P
x
’
i
n
e
v
e
n
t
s
c
a
l
c
u
l
a
t
e
d
b
y
P
Y
T
H
I
A
a
n
d
F
T
F
1
5
T
a
b
l
e
o
f
N
u
m
b
e
r
s
a
n
d
M
e
a
n
v
a
l
u
e
s
o
f
P
x
’
a
n
d
P
y
’
2
o
f
Λ
-
h
y
p
e
r
o
n
s
a
n
d
p
a
r
t
i
c
l
e
s
a
s
s
o
c
i
a
t
e
d
w
i
t
h
Λ
-
h
y
p
e
r
o
n
i
n
P
P
-
e
v
e
n
t
s
1
6
S
u
m
m
a
r
y
1.
W
e
o
b
s
e
r
v
e
s
t
r
o
n
g
2
-
p
a
r
t
i
c
l
e
P
t
c
o
r
r
e
l
a
t
i
o
n
s
b
e
t
w
e
e
n
s
t
r
a
n
g
e
p
a
r
t
i
c
l
e
s
i
n
P
P
i
n
t
e
r
a
c
t
i
o
n
s
.
2
.
W
e
l
l
k
n
o
w
n
e
v
e
n
t
g
e
n
e
r
a
t
o
r
s
–
P
y
t
h
i
a
a
n
d
G
e
a
n
t
4
F
T
F
g
i
v
e
v
e
r
y
d
i
f
f
e
r
e
n
t
p
r
e
d
i
c
t
i
o
n
s
f
o
r
t
h
e
s
e
c
o
r
r
e
l
a
t
i
o
n
s
.
3
.
T
h
e
c
o
r
r
e
l
a
t
i
o
n
s
a
r
e
c
o
n
n
e
c
t
e
d
w
i
t
h
m
a
i
n
a
s
s
u
m
p
t
i
o
n
s
o
f
v
a
r
i
o
u
s
s
t
r
i
n
g
m
o
d
e
l
s
u
s
e
d
i
n
P
y
t
h
i
a
a
n
d
G
e
a
n
t
4
F
T
F
.
Detailed study of the correlations at SPD will provide data for
tuning and calibration of the main simulation generators --
Pythia and Geant4 in high energy physics!
1
7
2
3
M
a
y
2
0
2
0
2
0
0
5
.
1
1
4
9
5
[
n
u
c
l
-
e
x
]
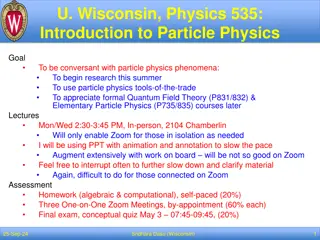
A new laboratory to study hadron–hadron interactions
ALICE Collaboration
Figure 3: Experimental p–X and p–W correlation functions. Measured p–X (a) and p–W (b) correlation
functions in pp collisions at p s = 13 TeV. The experimental data are shown as black symbols. The black vertical
bars and the grey boxes represent the statistical and systematic uncertainties, and the square brackets show the
bin width. The measurements are compared with theoretical predictions, shown as coloured bands, that assume
either Coulomb or Coulomb+strong HAL QCD interactions. The width of the curves including HAL QCD predictions
represents the uncertainty associated to the calculation and the grey shaded band represents, in addition, the
uncertainties associated with the determination of the source radius.
F
T
F
<P’x> <P’y> (MeV/c)
Pi+ -15 0
Pi- -15 0
K+
-44
-1
K- -27 -1
<P’x> <P’y> (MeV/c)
Pi+ -2 0
Pi- -1 0
K+
-21
0
K- -3 0
H
I
J
I
N
G
,
J
e
t
s
e
t
7
.
3
W
h
a
t
a
b
o
u
t
P
y
t
h
i
a
,
A
n
g
a
n
t
y
r
,
Q
G
S
J
e
t
,
S
i
b
y
l
l
,
L
A
Q
G
S
M
,
F
T
F
a
n
d
Q
G
S
m
o
d
e
l
s
o
f
G
e
a
n
t
4
?
P
P
i
n
t
e
r
a
c
t
i
o
n
s
,
S
q
r
t
S
=
1
7
.
2
G
e
V
,
m
i
n
b
i
a
s
Explore the study of particle correlations in high energy physics, focusing on jet fragmentation functions, azimuthal correlations, and Pt-correlation calculation methods. Discover insights from research papers and experimental measurements in particle collisions.

Download Presentation

Please find below an Image/Link to download the presentation.
The content on the website is provided AS IS for your information and personal use only. It may not be sold, licensed, or shared on other websites without obtaining consent from the author.If you encounter any issues during the download, it is possible that the publisher has removed the file from their server.
You are allowed to download the files provided on this website for personal or commercial use, subject to the condition that they are used lawfully. All files are the property of their respective owners.
The content on the website is provided AS IS for your information and personal use only. It may not be sold, licensed, or shared on other websites without obtaining consent from the author.
E N D
Presentation Transcript
Towards Study of 2-Particle Pt Correlations A. Galoyan and V. Uzhinsky PHYSICS REPORTS 107 (1984) 59 e+e- PHYSICS AT PETRA THE FIRSTFIVE YEARS, Sau Lan WU and DESY. Jets in High Energy Physics Fragmentation function It is the well-known procedure! 1
Example 19 Aug. 2020 arXiv:2008.08631 [nucl-exp] Measurement of semi-inclusive jet fragmentation functions in Au+Au collisions at Sqrt(SNN) = 200 GeV in STAR, Saehanseul Oh (for the STAR Collaboration) In-medium modifications of fragmentation functions have been previously reported by LHC collaborations for inclusive jet populations [4, 5]. [[4] M. Aaboud et al., Measurement of jet fragmentation in Pb+Pb and pp collisions at sqrt(sNN) = 2:76 TeV with the ATLAS detector at the LHC , Eur. Phys. J. C 77, no.6, 379 (2017). [5] S. Chatrchyan et al., Measurement of jet fragmen- tation into charged particles in pp and PbPb collisions at sqrt(sNN )= 2:76 TeV , JHEP 10, 087 (2012). Figure 1: Semi-inclusive jet fragmentation functions measured in 40 60% Au+Au collisions for three pT;jet ranges (closed markers), compared to those calculated by PYTHIA 8 for pp collisions (dashed lines). Measured distributions are corrected for detector effects and uncorrelated background effects. 2
Other exp. method azimuthal correlations 11 Aug. 2020 2008.04187 [hep-exp] Measurement of two-particle correlations in hadronic e+e collisions at Belle, A. Abdesselam et.al. The ridge signal , is a phenomenon widely observed in high multiplicity proton-proton, proton-ion and deutron-ion collisions, which is not yet fully understood. Two-particle correlation functions for beam (left) and thrust (right) axis analyses with offline multiplicity Noffline Trk 12. 3
Other exp. method azimuthal correlations 31 Oct. 2019 1910.14403 [nucl-ex] Azimuthal correlations of prompt D mesons with charged particles in pp and p Pb collisions at psNN = 5:02 TeV ALICE Collaboration 4
What to do if there is No Jet? 2-Particle Pt Correlations 5
Pt-Correlation: calculation method 1. We calculated 1000000 PP-events at S=25 GeV using FTF and Pythia generators in SPDRoot 2. We selected events with hyperons, and calculated Cos( _ ) = Px_ / Pt_ Sin( _ ) = Py_ / Pt_ 3. For these events we transformed Px and Py momenta of particles associated with hyperon in the new rotated coordinate system. Px = Px * Cos( _ ) + Py * Sin( _ ) Py = - Px * Sin( _ ) + Py * Cos( _ ) (It is obviously, that for hyperon Px =Pt; Py =0) 4. We performed analysis of transformed Px and Py 2 of particles produced with hyperons. 6
Comparison of Px of K0-mesons and -bar hyperons associated with hyperon in PP- events calculated by FTF <Px _ > = 709 MeV/ , N_ = 89380 <Px _K0> = -110 MeV/ , N_K0 = 66070 <Px _ bar> = -160 MeV/ , N_ bar = 9661 7
Px of particles associated with hyperons in PP-events calculated by FTF <Px _ > = 709 MeV/c <Px _K0> = -110 MeV/ , <Px _K+>=-117 MeV/ , <Px _K- > = -69 MeV/ <Px _ 0> = -27 MeV/ , <Px _ +>=-38.5 MeV/ <Px _ - > = -38 MeV/ 8
Correlations of mean Px of -bar hyperons, K and mesons with hyperon Px in PP-events calculated by FTF 9
Correlations of mean Py2of -bar hyperons, K and mesons with hyperon Px in PP-events calculated by FTF <Py 2 bar> = 230 (MeV/c)2 < Py 2 K0> = 160 (MeV/c)2 < Py 2 0> = 86 (MeV/c)2 10
Px of particles associated with hyperons in PP- events calculated by Pythia We calculated 1000000 PP-events at S=25 GeV using Pythia in SPDRoot <Px _ > = 723 MeV/c, N_ =183551; <Px _ bar>=-39 MeV/c, N_ bar=17243 <Px _K0> = -70 MeV/c, <Px _K+>=-67 MeV/c, <Px _K- > = -77 MeV/c <Px _ 0> = -29.5 MeV/c, <Px _ +>=-38 MeV/c, <Px _ - > = -22 MeV/c 11
Correlations of mean Px, Py2of -bar hyperons, K and mesons with hyperon Px in PP-events calculated by PYTHIA <Py 2 bar> = 191 (MeV/c)2<Py 2 K0> = 154 (MeV/c)2<Py 2 0> = 83 (MeV/c)2 12
Comparison of correlations of mean Px of -bar hyperons and K- mesons with hyperon Px in events calculated by PYTHIAandFTF 13
Comparison of correlations of mean Py2of -bar hyperons and K- mesons with hyperon Px in events calculated by PYTHIA and FTF 14
Comparison of correlations of mean Px and Py2 of -mesons with hyperon Px in events calculated by PYTHIA and FTF 15
Table of Numbers and Mean values of Px and Py2 of -hyperons and particles associated with -hyperon in PP-events Gene- rator bar K+ K- K0 + - 0 FTF N 89380 N 9661 N 59042 N 16800 N 66070 N 297824 N 229430 N 309884 N N 17243 N 140147 N 52538 N 180015 N 896081 N 827179 N 979377 Pythia 183551 <Px> 709.7 <Px> -161.9 <Px> -117 <Px> -69 <Px> -110 <Px> -38.5 <Px> -38 <Px> -27 FTF <Px> 723.5 <Px> -39 <Px> -67 <Px> -77 <Px> -70 <Px> -38 <Px> -21.8 <Px> -29.5 Pythia <Py2> 0 <Py2> 233 <Py2> 163 <Py2> 158 <Py2> 163 <Py2> 94.5 <Py2> 94.3 <Py2> 86.5 FTF <Py2> 0 <Py2> 190.6 <Py2> 165 <Py2> 143 <Py2> 154.9 <Py2> 96 <Py2> 82 <Py2> 82.9 Pythia 16
Summary 1. We observe strong 2-particle Pt correlations between strange particles in PP interactions. 2. Well known event generators Pythia and Geant4 FTF give very different predictions for these correlations. 3. The correlations are connected with main assumptions of various string models used in Pythia and Geant4 FTF . Detailed study of the correlations at SPD will provide data for tuning and calibration of the main simulation generators -- Pythia and Geant4 in high energy physics! 17
23 May 2020 2005.11495 [nucl-ex] A new laboratory to study hadron hadron interactions ALICE Collaboration Figure 3: Experimental p X? and p W? correlation functions. Measured p X? (a) and p W? (b) correlation functions in pp collisions at p s = 13 TeV. The experimental data are shown as black symbols. The black vertical bars and the grey boxes represent the statistical and systematic uncertainties, and the square brackets show the bin width. The measurements are compared with theoretical predictions, shown as coloured bands, that assume either Coulomb or Coulomb+strong HAL QCD interactions. The width of the curves including HAL QCD predictions represents the uncertainty associated to the calculation and the grey shaded band represents, in addition, the uncertainties associated with the determination of the source radius.
PP interactions, SqrtS= 17.2 GeV, min bias FTF <P x> <P y> (MeV/c) Pi+ -15 0 Pi- -15 0 K+ -44 -1 K- -27 -1 HIJING, Jetset7.3 <P x> <P y> (MeV/c) Pi+ -2 0 Pi- -1 0 K+ -21 0 K- -3 0 What about Pythia, Angantyr, QGSJet, Sibyll, LA QGSM, FTF and QGS models of Geant4?