Top 5 HR Analytics Tools That Every HR Should Know
It is important understand what HR tools can be the most beneficial for your job role. An HR Analytics training can help you learn about the most in-demand and efficient tools, their applications and how they make your job easier.
Uploaded on Dec 17, 2024 | 0 Views
Download Presentation

Please find below an Image/Link to download the presentation.
The content on the website is provided AS IS for your information and personal use only. It may not be sold, licensed, or shared on other websites without obtaining consent from the author. Download presentation by click this link. If you encounter any issues during the download, it is possible that the publisher has removed the file from their server.
E N D
Presentation Transcript
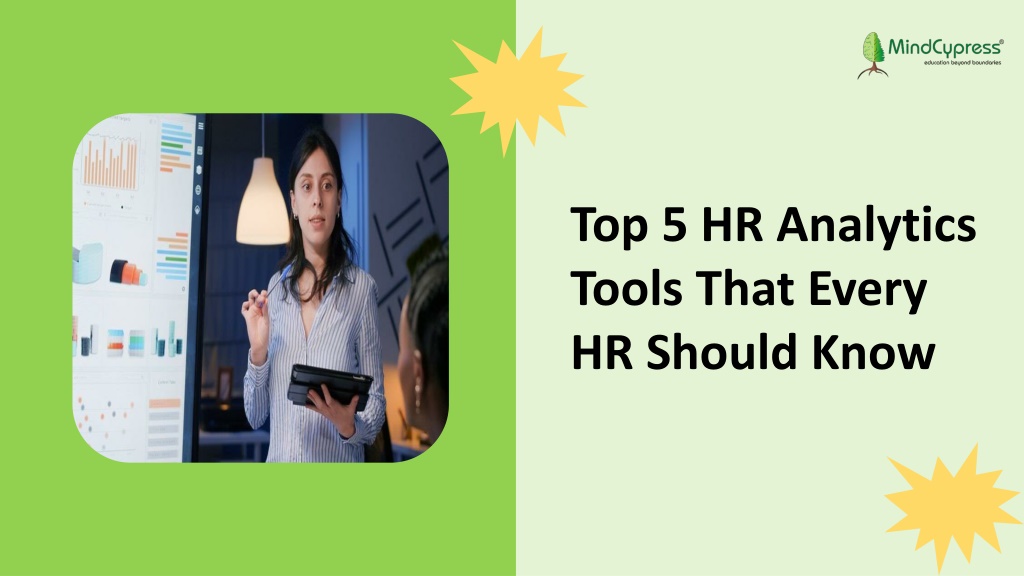
Top 5 HR Analytics Tools That Every HR Should Know
To become the best in HR industry, hone your skills in the essential HR tools. Here are some R The most used tool for HR analytics is R. One can utilize R for diving into large data sets and statistical analysis and visualization. Millions of rows of data can be analyzed and cleaned with it. Additionally, it enables you to visualize your findings and data. RStudio is a well-noted Integrated Development Environment (IDE) for R. Software that offers extra features for data analysis and software development is called an IDE. Hence, it is easier to use the software. In a nutshell, RStudio does all of R's functions, but better. A code editor, the R console, a workspace that is easily accessible, a history log, and space for plots and files are all included in the RStudio interface. All in all, R is an excellent tool for analyzing and visualizing vast amounts of data.
Python R is interchangeable with Python, another computer language. There is a lot of discussion in the data science community on which of the two will be the preferred tool for data scientists. R is more adept at doing statistical analysis, has a more vibrant statistics community, and works better for visualizations. However, Python is simpler to learn and has just somewhat fewer features. PyCharm and Spyder are frequently used IDEs. What RStudio is to R, these tools are to Python. These open-source IDEs give data scientists all the Python tools they require. Data science is the focus of Spyder, which stands for Scientific Python Development Editor. It consists of an advanced editor, an interactive console, documentation viewer, along with advanced development tools that with the option of visualization.
Excel The fundamentals should not be overlooked while discussing HR analytics technologies. Most of us began with Excel. Data that is manually extracted from any of your HR systems usually appears as a comma-separated value (CSV) dataset. Excel makes it simple to open and edit these files. Excel has the advantage of being incredibly user-friendly and intuitive for the majority of us HR data experts. For instance, you may rapidly turn a dataset into a table and look for outliers in each column's data range to see how clean your data is.
Power BI Microsoft holds the top position in Gartner's Magic Quadrant for Business Intelligence. For this reason, we used Power BI from Microsoft. It helps in effectively simplifying data aggregation, analysis, and visualization. Connecting to numerous source systems, like as machine learning APIs, live Twitter feeds, or SQL databases containing people data, is simple with Power BI. Power BI then integrates all of these disparate data sources. You can integrate several data sources into a single, sizable database that is appropriate for reporting or analysis by using this straightforward aggregation procedure. A pivot table can then be made using the combined data (using Power Pivot). This enables you to quickly gain insight on important aspects of your staff. With the help of Power BI s capacity for dashboarding, that same data. Thanks to the capacity of Power BI's dashboard, that same data can then be transformed into a dashboard as too.
Tableau Because it allows for the collection and visualization of multiple data sources, Tableau is a lot like Power BI. The software, which was first developed in 2003 as a for-profit outlet for Stanford University research, has become a sensation in the visualization industry. In terms of visualization, Tableau is possibly the greatest business intelligence (BI) solution available. From 2012 to 2019, it was listed in the Gartner Magic Quadrant for seven years in a row.
Conclusion It is important understand what HR tools can be the most beneficial for your job role. An HR Analytics training can help you learn about the most in- demand and efficient tools, their applications and how they make your job easier.
Slide End and Resource Resource: https://mindcypress.com/blogs/human-resource- management/top-5-hr-analytics-tool-that-every-hr-should-know Email: info@mindcypress.com Phone: +1-206-922-2417
