Time Series Analysis Accelerator: NATSA Innovation
"Discover how NATSA, a Near-Data Processing Accelerator, revolutionizes time series analysis by boosting performance and efficiency. Explore applications, motifs, and discords in this groundbreaking research presented at ICCD 2020." (254 characters)
Uploaded on | 1 Views
Download Presentation

Please find below an Image/Link to download the presentation.
The content on the website is provided AS IS for your information and personal use only. It may not be sold, licensed, or shared on other websites without obtaining consent from the author. If you encounter any issues during the download, it is possible that the publisher has removed the file from their server.
You are allowed to download the files provided on this website for personal or commercial use, subject to the condition that they are used lawfully. All files are the property of their respective owners.
The content on the website is provided AS IS for your information and personal use only. It may not be sold, licensed, or shared on other websites without obtaining consent from the author.
E N D
Presentation Transcript
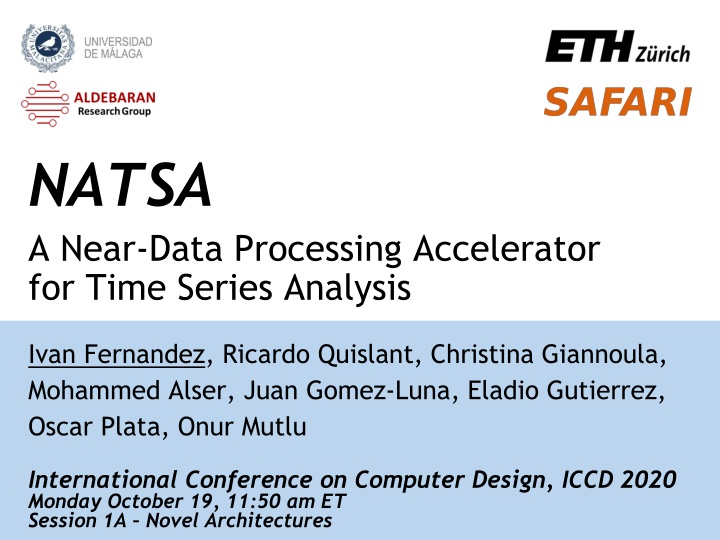
NATSA A Near-Data Processing Accelerator for Time Series Analysis Ivan Fernandez, Ricardo Quislant, Christina Giannoula, Mohammed Alser, Juan Gomez-Luna, Eladio Gutierrez, Oscar Plata, Onur Mutlu International Conference on Computer Design, ICCD 2020 Monday October 19, 11:50 am ET Session 1A Novel Architectures
Executive Summary Problem: time series analysis is bottlenecked by data movement in conventional hardware platforms Goal: enable high-performance and energy-efficient time series analysis for a wide range of applications Contributions: first near-data processing accelerator for time series analysis based on matrix profile algo. NATSA Evaluations: NATSA provides up to 14.2x higher performance and consumes up to 27.2x less energy than a DDR4 platform with 8 OoO cores NATSA outperforms an HBM-NDP platform with 64 in-order cores by 6.3x while consuming 10.2x less energy 2
Talk Outline Motivation NATSA Design NATSA Evaluation Conclusions 3
Talk Outline Motivation NATSA Design NATSA Evaluation Conclusions 4
Time Series Analysis Time series analysis has many applications Climate change [1] Medicine [2] Economics [3] Signal processing [4] [1] M. Saker et al. Exploring the relationship between climate change and rice yield in Bangladesh: An analysis of time series data . Agr. Sys, 2012 [2] CK Peng et al. Quantification of scaling exponents and crossover phenomena in nonstationary heartbeat time series . Chaos, 1995 [3] Clive Granger and Paul Newbold. Forecasting economic time series , Academic Press, 2014 [4] O. Rioul and M. Vetterly. Wavelets and signal processing . IEEE signal processing magazine, 1991 5
Time Series Analysis Time series analysis has many applications and more [6]! Astronomy [5] [5] Vio, R., et al. "Time series analysis in astronomy-an application to quasar variability studies." The Astrophysical Journal, 1992 [6] Shumway, R. and D. Stoffer. Time series analysis and its applications: with R examples . Springer, 2017 6
Motifs and Discords Given a sliced time series into subsequences motif discovery focuses on finding similarities discord discovery focuses on finding anomalies Naive example of anomaly detection: 7
Matrix Profile Matrix profile: an algorithm (and an open source tool), intended for motif and discord discovery Easy to use: only subsequence length is needed 8
SCRIMP SCRIMP: state-of-the-art CPU matrix profile implementation (also GPU and CPU-GPU available) We characterize SCRIMP using an Intel Xeon Phi KNL 9
SCRIMP SCRIMP: state-of-the-art CPU matrix profile implementation (also GPU and CPU-GPU available) We characterize SCRIMP using an Intel Xeon Phi KNL SCRIMP is heavily bottlenecked by data movement 10
Goal Our goal: Enabling high-performance and energy-efficient time series analysis for a wide range of applications by minimizing the overheads of data movement To this end, we propose NATSA, the first Near-data processing Accelerator for Time Series Analysis that exploits 3D-stacked HBM memories and specialized processing logic 11
Talk Outline Motivation NATSA Design NATSA Evaluation Conclusions 12
NATSA Overview NATSA is designed to Fully exploit the memory bandwidth of HBM Employ the required amount of computing resources to provide a balanced solution NATSA consists of multiple processing units (PUs) Each PU includes energy-efficient floating-point units and bitwise operators PUs are designed to compute batches of diagonals of the distance matrix following a vectorized approach 13
NATSA Integration NATSA PUs consist of four hardware components: Dot Product Unit Distance Compute Unit Dot Product Update Unit Profile Update Unit 14
NATSA PU Execution Flow The execution flow through the hardware components of a PU includes the following steps: 1) Dot product computation of the first element of the diagonal 15
NATSA PU Execution Flow The execution flow through the hardware components of a PU includes the following steps: 2) Euclidean distance computation of the first element of the diagonal 16
NATSA PU Execution Flow The execution flow through the hardware components of a PU includes the following steps: 3) First profile update 17
NATSA PU Execution Flow The execution flow through the hardware components of a PU includes the following steps: 4) Dot product update 18
NATSA PU Execution Flow The execution flow through the hardware components of a PU includes the following steps: 5) Second and successive Euclidean distance computations 19
NATSA PU Execution Flow The execution flow through the hardware components of a PU includes the following steps: 6) Second and successive profile updates 20
Workload Scheduling Scheme We ensure load balancing among PUs using a static partition scheduling We assign pairs of diagonals to each PU that sum the same number of cells to compute 21
Programming Interface The user is responsible for 1) allocating the time series and 2) providing the subsequence length NATSA will provide the user the computed profile and profile index vectors as a result 22
Talk Outline Motivation NATSA Design NATSA Evaluation Conclusions 23
Simulation Environment We use an in-house integration of ZSim and Ramulator to simulate general-purpose hardware platforms We use McPAT to obtain area and power for the general-purpose hardware platforms We use the integration of Aladdin and gem5 to obtain performance, power and area of NATSA We obtain the memory side power consumption using Micron Power Calculator 24
Hardware Platforms We define several representative simulated hardware platforms for the evaluation: Hardware Platform Cores / PUs Caches (L1 / L2 / L3) Memory DDR4-OoO 8 OoO @ 3.75 GHz 32KB / 256KB / 8MB 16 GB DDR4-2400 DDR4-inOrder 64 in-order @ 2.5 GHz 32KB / - / - 16 GB DDR4-2400 HBM-OoO 8 OoO @ 3.75 GHz 32KB / 256KB / 8MB 4 GB HBM2 HBM-inOrder 64 in-order @ 2.5 GHz 32KB / - / - 4 GB HBM2 NATSA 48 PUs @ 1 GHz 48KB (Scratchpad) 4 GB HBM2 We also evaluate NATSA against real hardware platforms (Intel Xeon Phi KNL, NVIDIA Tesla K40c and NVIDIA GTX 1050) 25
Performance of NATSA We compare the performance of NATSA with respect to the general-purpose hardware platforms 26
Performance of NATSA We compare the performance of NATSA with respect to the general-purpose hardware platforms NATSA outperforms the baseline (DDR4-OoO) by up to 14.2x (9.9x on average) 27
Power Consumption We compare the power consumption of NATSA with respect to simulated and real hardware platforms 28
Power Consumption We compare the power consumption of NATSA with respect to simulated and real hardware platforms NATSA has the lowest power consumption Most of NATSA s power is consumed by memory 29
Energy Consumption We compare the energy consumption of NATSA with respect to simulated and real hardware platforms 30
Energy Consumption We compare the energy consumption of NATSA with respect to simulated and real hardware platforms NATSA reduces energy consumption by up to 27.2x over DDR4-OoO by up to 10.2x over HBM-inOrder by up to 1.7x over an NVIDIA K40c 31
Area We compare the area of NATSA with respect to simulated and real hardware platforms 32
Area We compare the area of NATSA with respect to simulated and real hardware platforms NATSA (even at 45nm technology node) requires the least area 33
Talk Outline Motivation NATSA Design NATSA Evaluation Conclusions 34
Executive Summary Problem: time series analysis is bottlenecked by data movement in conventional hardware platforms Goal: enable high-performance and energy-efficient time series analysis for a wide range of applications Contributions: first near-data processing accelerator for time series analysis based on matrix profile algo. NATSA Evaluations: NATSA provides up to 14.2x higher performance and consumes up to 27.2x less energy than a DDR4 platform with 8 OoO cores NATSA outperforms an HBM-NDP platform with 64 in-order cores by 6.3x while consuming 10.2x less energy 35
NATSA A Near-Data Processing Accelerator for Time Series Analysis Ivan Fernandez, Ricardo Quislant, Christina Giannoula, Mohammed Alser, Juan Gomez-Luna, Eladio Gutierrez, Oscar Plata, Onur Mutlu International Conference on Computer Design, ICCD 2020 Monday October 19, 11:50 am ET Session 1A Novel Architectures


