Theory of Unequal Exchange and Transfers of Value
Theory and empirical evidence on unequal exchange and transfers of value in international trade according to Emmanuel's analysis. Discusses causes of transfers of value and conditions for ruling out unequal exchange. Utilizes labor values and prices of production to understand the dynamics of unequal exchange.

Download Presentation

Please find below an Image/Link to download the presentation.
The content on the website is provided AS IS for your information and personal use only. It may not be sold, licensed, or shared on other websites without obtaining consent from the author.If you encounter any issues during the download, it is possible that the publisher has removed the file from their server.
You are allowed to download the files provided on this website for personal or commercial use, subject to the condition that they are used lawfully. All files are the property of their respective owners.
The content on the website is provided AS IS for your information and personal use only. It may not be sold, licensed, or shared on other websites without obtaining consent from the author.
E N D
Presentation Transcript
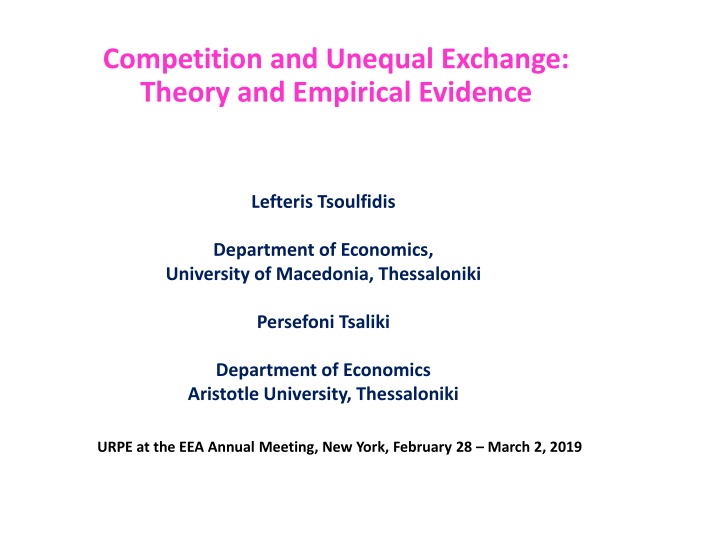
Competition and Unequal Exchange: Theory and Empirical Evidence Lefteris Tsoulfidis Department of Economics, University of Macedonia, Thessaloniki Persefoni Tsaliki Department of Economics Aristotle University, Thessaloniki URPE at the EEA Annual Meeting, New York, February 28 March 2, 2019
Emmanuel and Unequal Exchange Standard neoclassical international trade teaches that trade benefits all participants. Emmanuel (1972 [1969]) explained exploitative relations may result just from commodity trade and not necessarily from extra economic forces. Emmanuel in his analysis hypothesized mobility of capital a uniform international rate of profit and the formation of international prices of production. Emmanuel, however, does not escape from the standard neoclassical theory since he assumed the same technology between the trading partners. Firms producing at (direct) prices lower (higher) than the international prices of production make excess profits (losses). The lower wages in LDC result in the production of more surplus value.
Emmanuel and Unequal Exchange (continued) Two are the causes of transfers of (surplus) value unequal exchange in the broad sense : The domestic value compositions of capital are different from the international average. This is quite ordinary in the domestic trade but of negligible importance in the international trade (assumption of uniform technology) unequal exchange in the narrow sense : The lower (real) wages in LDC leads to higher rates of surplus value gives rise to particularly large transfers of value. Emmanuel s great contribution is the theorization of Unequal Exchange and the associated with it transfers of values (exploitation) not by resorting to easy arguments invoking dependence, monopoly power and imperialism in general but in the by far more difficult case of ordinary and beyond any suspicion international trade where exchange appears as if the trading partners were absolutely equal.
Transfers of value All variables are expressed in terms of labour valuesd=c+v+s Prices of productionp=(1+r)(c+v) The transfers of value i=pi-diwhere i=A, B or i=r(ci+vi)-si Divide numerator and denominator of r by v and express r in terms of RSV = e , and VCC=k r=e/(1+k) We replace r in the formula of unequal exchange and we get i=vi[e(1+ki)(1+k)-1 - ei] From the above formula (assuming int l equalization of r we end up with the necessary condition to rule out the case of unequal exchange is the equality of the RSV and VCC to the int l average respective rates. Furthermore, even if the RSV are equal to the int l average we may have unequal exchange in the broad sense. We do not exclude other intermediate cases.
Variables We use i-o data of the USA and China both expressed in $ We deflate the i-o data with domestic deflators We define the labour values The RSV The rate of profit The vertically integrated composition of capital Prices of Production The Int l POP is the average of the two national POP The Unequal Exchange = int l PoP- domestic values.
1.1 Rate of Surplus-Value 1.05 CHN 2013 1 0.95 0.9 0.85 USA 2013 0.8 0.75 1994 1995 1996 1997 1998 1999 2000 2001 2002 2003 2004 2005 2006 2007 2008 2009 2010 7 Value Composition of Capital 6.5 USA 2013 6 5.5 5 4.5 4 CHN 2013 3.5 3 1994 1995 1996 1997 1998 1999 2000 2001 2002 2003 2004 2005 2006 2007 2008 2009 2010
Average unit labour values, USAand China, 1995-2009 and 2010-2014 0.4 CHN 2013 0.35 0.3 0.25 0.2 0.15 CHN 2016 0.1 0.05 USA 2013 USA 2016 0 1994 1996 1998 2000 2002 2004 2006 2008 2010 2012 2014
Aggregate effect of unequal exchange as proportion of total bilateral trade, USA & China 1995-2009 20 15 USA 10 5 0 1994 1995 1996 1997 1998 1999 2000 2001 2002 2003 2004 2005 2006 2007 2008 2009 2010 -5 -10 CHN -15 -20
Aggregate effect of unequal exchange as proportion to total output, 1995-2011 0.1 USA 2013 0 1994 1995 1996 1997 1998 1999 2000 2001 2002 2003 2004 2005 2006 2007 2008 2009 2010 -0.1 CHN 2013 -0.2 -0.3 -0.4 -0.5
Results UX for USA and CHINA, 2009 USA China Labour values (worker years) (1) Vx=d*z Worker hours exported (3) = (1)*(2) Labour values (worker years) Imports (000 $) (2) Vx=d*z Worker hours exported Exports (000 $) 2003 Agriculture, Hunting, Forestry and Fishing Mining and Quarrying Food, Beverages and Tobacco Textiles and Textile Products Leather, Leather and Footwear Wood and Products of Wood and Cork Pulp, Paper, Paper , Printing and Publishing Coke, Refined Petroleum and Nuclear Fuel Chemicals and Chemical Products 0.2173 0.0822 0.2014 0.1842 0.1726 699149 393597 4516159 39746583 14700791 151948.18 32334.292 909468.8 7321886.6 2536762.8 0.0102 0.0056 0.0090 0.0128 0.0178 11091947 950063 2826804 441766.07 163392.93 113002.1 5317.393 25494.87 5634.179 2914.090 0.1785 2830670 505353.97 0.0140 315466 4427.611 0.1500 4129072 619261 0.0101 1713246 17371.48 0.1059 0.1016 0.1433 0.1294 189849 9302739 11582346 4142457 20099.908 945088.05 1660200.4 536154.19 0.0043 0.0085 0.0110 0.0102 361451 10447597 978901 421964 1537.022 88681.47 10815.33 4325.016 Rubber and Plastics Other Non-Metallic Mineral Basic Metals and Fabricated Metal 0.1201 0.1441 15071711 27257489 1809448.3 3928382.6 0.0112 0.0095 3196905 6587284 35961.26 62694.91 Machinery, Nec Electrical and Optical Equipment 0.1578 0.1548 121604134 6196508 19189655 959011.98 0.0186 0.0116 15086663 7427509 280874.4 86108.46 Transport Equipment Manufacturing, Nec; Recycling 0.1416 43170620 305533874 6111138.4 47236195 0.0098 389724 3826.986 Total Labour commanded in 1000$ 62400683 748986.6 83.31 6.47
Unequal Exchange: an Example Looking at trade from the point of view of USA Column 1: Unit labour values of the 16 industries producing tradables Column 2 : Imports of China (or Exports of USA to China) evaluated in 000 USD. Column 3 (the product of columns 1 and 2) Imports evaluated in labour values The column Sum of imports in 000 $ over the sum imports in labour values = the cost of a labour year in USA which amounts to 83.31 thousand USD Similarly is derived the labour year in China costs only 6.47 thousand USD Alternatively For every 1000$ that are spend on imports in USA, China imports 1/83.31=0,012 labour years. For every 1000$ spent on imports in China, USA imports 1/6.47=0,155 Chinese labour years . If instead of years we select days of labour and we further suppose that the number of working days are the same in the two countries . Then we have China for every 1000$ spent on imported goods from Germany whose production requires 0,012x 5 days x 52 weeks= 3.12 labour days in USA USA the same 1000$ spent on Chinese exported to USA products whose production requires 0.155 x 5 days x 52 weeks = 40.3 labour days in China It follows that in 2009 one US labour year is 12.88 times higher than that of China
Equivalence of one dollar to worker year between USA and China, 1995-2009 USA China Year (dollar-worker year equivalence) 0.015 (dollar-worker year) equivalence) 0.411 China/ USA 1995 27.07 1996 0.015 0.370 24.94 1997 0.015 0.341 22.93 1998 0.015 0.312 21.43 1999 0.015 0.286 19.27 2000 0.015 0.253 16.49 2001 0.016 0.240 15.06 2002 0.014 0.215 14.98 2003 0.014 0.206 14.79 2004 0.013 0.211 15.81 2005 0.014 0.207 15.19 2006 0.011 0.194 17.36 2007 0.013 0.172 12.84 2008 0.013 0.157 12.38 2009 0.012 0.155 12.88 The USA with the same amount of money, i.e., one dollar, extracts through trade 12.88 times more labour time (years) than China in the year 2009 and the gains were much higher in the first years of our study during which the unit values in the USA were much lower than those in China.
Average absolute cost of 16 tradables USA & China, in deflated USD 0.65 USA 1995-2009 CHN 2000-2014 0.6 0.55 0.5 CHN 1995-2009 USA 2000-2014 0.45 0.4 1994 1995 1996 1997 1998 1999 2000 2001 2002 2003 2004 2005 2006 2007 2008 2009 2010 2011 2012 2013 2014 2015
Average absolute cost of tradables USA vs. China, Deflated USD and in terms of PPP 0.7 CHN 2000-2014 USA 1995-2009 0.6 0.5 USA 2000-2014 CHN 1995-2009 0.4 0.3 CHN 2000-2014 PPP 0.2 0.1 CHN 1995-2009 PPP 0 1994 1995 1996 1997 1998 1999 2000 2001 2002 2003 2004 2005 2006 2007 2008 2009 2010 2011 2012 2013 2014 2015 2016
Conclusions 1 1. Equalization of profit rates and unequal rates of surplus value in the two countries did not give rise to UX in the strict sense of the term. 2. The same technology assumption across trading partners (of both NC and UX approaches) does not seem to fit the facts. In particular, US s higher capitalization of production explains its lower than the Chinese labour values. 3. The lower wages in China do not necessarily lead to higher rates of surplus value, as a consequence to higher US productivity resulting from the higher VCC. 4. Our study shows that the USA transfer of values from the trade exceed those of China. In this sense the trade may be characterized as asymmetric since one of the trading partners gains more than the other!
Conclusions 2 5. The transfers of value do not necessarily indicate exploitative relations between countries and by extension social classes, but the difference in the level of economic development. 5. The concept of exploitation refers to class relations developed domestically and not between countries. 6. It seems that Marx had predicted surprisingly well the consequences in terms of gains and losses resulting from international trade: Loss and gain within a single country cancel each other out. But not so with trade between different countries three days of labour of one country can be exchanged against one of another country [...]. Here the law of value undergoes essential modification [...]. The relationship between labour days of different countries may be similar to that existing between skilled, complex labour and unskilled simple labour within a country. In this case, the richer country exploits the poorer one, even where the latter gains by the exchange (Marx, 1861-1863, pp. 105-6). 5.
Conclusions 3 8. On the surface the dominance of the LOP, the equalization of ROP and probably of the RSV give the impression that the exchanges are conducted on the basis of equivalent relations between the partners. 9. By contrast, the present research argued that the inequalities are couched on the sphere of production, that is, on the labor values of tradable goods and are consistent with the differences in real wages and the unequal development.
Thank you for your attention!


")