The Economics and Politics of Foreign Aid and Domestic Revenue Mobilization
This study explores the relationship between foreign aid, taxation, and domestic revenue mobilization, highlighting the impact of aid on tax/GDP ratios and the constraints faced in revenue systems. It discusses how aid influences policy choices, accountability, and bureaucratic costs, impacting revenue performance. The research questions delve into long-term equilibrium relationships, aid composition, conditionality effects, and volatility impacts on revenue generation.
Download Presentation

Please find below an Image/Link to download the presentation.
The content on the website is provided AS IS for your information and personal use only. It may not be sold, licensed, or shared on other websites without obtaining consent from the author.If you encounter any issues during the download, it is possible that the publisher has removed the file from their server.
You are allowed to download the files provided on this website for personal or commercial use, subject to the condition that they are used lawfully. All files are the property of their respective owners.
The content on the website is provided AS IS for your information and personal use only. It may not be sold, licensed, or shared on other websites without obtaining consent from the author.
E N D
Presentation Transcript
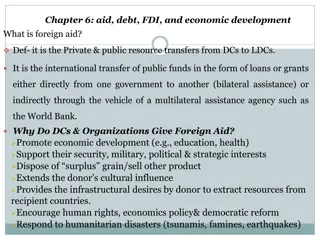
The Economics and Politics of Foreign Aid and Domestic Revenue Mobilization Abrams Mbu Enow Tagem University of Nottingham African Economic Conference 4 - 6 December 2017 1
Importance of DRM The advent of SDGs underpins the importance of domestic revenue mobilization, especially increasing taxes. Social sector spending on key areas like health, education and social protection is equally important. Aim of the paper Does a foreign aid influence tax/GDP ratios in the long-run? 2
Constraints on DRM Weak tax administrations and revenue systems. Tax bases are small and narrow: Difficulties in taxing bases that are growing (resource extraction, MNCs, high net wealth individuals). The income tax base (formal sector employment) and the consumption tax base (private spending) are growing slowly. Large informal and agricultural (subsistence) sectors. The political environment and influence of interest groups: Too many tax incentives. Corrupt practices and extensive rent-seeking by politicians in charge of tax policy. 3
Aid, Donors and Taxation Due to the aforementioned constraints on DRM aid plays a role in influencing DRM. The impact of aid on taxes reflects a revenue choice depending on political economy factors, based on the relative political costs of aid and tax. Accountability: Donors have to account to their parliaments; they need to monitor their aid. Recipients have to account to donors on how aid is spent; and also to their own constituencies. Autonomy: Donors attach conditions on their aid and recipients need to meet these conditions. Aid dependence = inflexibility. Bureaucratic costs: Donor proliferation (aid heterogeneity, different disbursment and monitoring mechanisms) makes costs of aid high.Tax administration/policy reform makes costs of tax low. 4
Aid, Donors and Taxtion (2) Donors also influence policy choices through: Technical assistance (transfer of knowledge). Conditionality (e.g. Revenue conditionality in donor-supported programs). Stability of aid flows: Unstable aid may undermine positive effects of aid; with a negative impact on taxes. Unstable aid flows may also underpin efforts to strengthen DRM. 5
Research Questions Does a long-run equilibrium relationship between the aid/GDP and tax/GDP ratios exist? (Behavioural effects). Does the composition of aid matter for the tax/GDP ratio? (Technical assistance) Does revenue conditionality in donor programs improve revenue performance? (Conditionality effects). What is the impact of aid volatility on revenue performance? (Volatility effects) 6
Econometric Issues Non-stationarity in aid/GDP and tax/GDP ratios: albeit with positive and/or negative trends. Heterogeneity in fiscal behaviour across developing countries. Short-run and long-run dynamics between aid and tax. Macroeconomic (business cycle) influences: recent financial crisis, devaluation of the CFA franc in 1994, trade liberalization episodes in the 1980s and 1990s, conflict (fragility), the recent scourge of terrorism. Simultaneity and endogeneity. 7
Literature Review Behavioural effects of aid on taxes: Morrissey and Torrance (2015); Clist and Morrissey (2011). Heterogeneous effects of aid grants and loans: Gupta et al., (2004); Benedek et al., (2012); Clist and Morrissey (2011). Technical assistance. Stability of aid flows: Lensink and Morrissey (2000). Conditionality effects of aid on taxes: Crivelli and Gupta (2016, 2017). 8
Data (1) Annual time-series data for 84 developing countries from 1980-2013. Net ODA disbursements, Loans, Grants and Technical assistance; all as percentages of GDP (OECD-DAC 2016). Total government revenue, total tax revenue, total non-resource tax revenue; all as percentages of GDP (UNU- WIDER/ICTD GRD 2016). 9
Data (2) Table A: Descriptive Statistics All countries (84) LDCs (38) LICs (46) SSA (40) LAC (19) MENA (6) AsiaPAC (18) Notes: LDCs = Least Developed Countries; LICs = Other Low-income Countries; SSA = Sub-Saharan Africa; LAC = Latin America and the Caribbean s; MENA = Middle East and North Africa; AsiaPAC = Asia and the Pacific. Tax/GDP = non-resource tax/GDP ratio; TA/GDP = Technical assistance to GDP ratio. Tax/GDP 12.92 11.30 14.30 12.51 13.37 13.48 12.87 Aid/GDP 5.58 9.63 2.27 8.08 1.61 1.61 5.69 Grants/GDP 3.51 6.22 1.29 5.48 0.97 1.04 2.73 Loans/GDP 3.11 3.54 1.21 3.36 0.98 0.94 1.62 TA/GDP 2.07 3.50 0.89 2.53 0.57 0.43 3.24 10
Data (3) Table B: Descriptive Statistics for countries with the highest/lowest tax/GDP ratios Tax/GDP Aid/GDP Bangladesh 5.91 Chad 5.03 DRC 5.69 Guinea-Bissau 5.05 Iran 5.57 Fiji 21.12 Jamaica 23.33 Lesotho 42.07 Seychelles 30.46 Swaziland 23.62 Notes: Tax/GDP = non-resource tax/GDP ratio; TA/GDP = Technical assistance to GDP ratio. DRC = Democratic Republic of Congo. The first five rows are countries with the lowest tax/GDP ratio and the last five rows are countries with the highest tax/GDP ratio. Grants/GDP 1.11 4.05 5.64 10.60 0.02 0.74 0.94 5.66 1.50 0.94 Loans/GDP 1.81 2.66 1.22 6.30 0.01 0.11 2.00 3.79 1.76 0.71 TA/GDP 0.47 2.02 0.56 5.66 0.04 1.55 0.54 4.45 1.94 1.21 2.11 6.70 6.17 16.18 0.04 1.77 1.49 9.88 3.35 1.74 11
Data (4) Figure 1: Distribution and Evolution of fiscal variables over time (1980-2013) Tax/GDP Aid/GDP 30 30 20 20 Tax (%GDP) Aid (%GDP) 10 10 0 0 1980 1988 1996 2004 2013 1980 1988 1996 2004 2013 1984 1992 2000 2008 1984 1992 2000 2008 Sources: OECD-DAC (2016), UNU-WIDER/ICTD GRD (2016) 12
Empirical Methods Dynamic Common Correlated Effects Mean Group Estimator (CCEMG) by Chudik and Pesaran (2015). Error Correction Model (ECM): Distinguishes LR from SR dynamics. Incorporates cross-country heterogeneity (in SR and LR). Allows for nonstationarity. Essentially, it wipes out macroeconomic (business cycle) effects: see slide 7 13
?1(???1) + ?? ??(?? ?) + ??? ?2( ???) + ????? 1+ ?? ??? + ?=1 ???= ?0?+ ?? Where ???= differenced log (tax/GDP) ratio ??? 1= lagged log (aid/GDP) ratio ???= differenced log (aid/GDP) ratio ?= cross-section averages of aid and taxes (Pesaran, 2006) ?? ?= lags of cross-section averages (Chudik and Pesaran, 2015) ?? COINTEGRATION between aid and taxes. ? ?? ?? ?? 0 we observe errorcorrection . Hence evidence of 14
Results Cointegrating (equilibrium) relationship between the aid/GDP and tax/GDP ratios. Long-run positive relationship between aid and taxes: Arguments suggest recipients prefer increasing taxes since the political costs are lower than the political costs of aid. 15
Table I: Baseline Heterogeneous Estimates Long-Run Aid/GDP Two-Lag CCEMG 0.077*** [0.027] 0.014 [0.012] -0.495*** [0.031] -16.09 0.092 I(0) -1.45 (0.148) 2371 (84) Short-Run Aid/GDP EC Coefficient ??? 1 ?-statistic Diagnostics RMSE Stationarity ?? test (?-value) Observations (?) Notes: *, **, and *** indicate significance at 10%, 5% and 1%. 16
Exploratory Analysis Heterogeneity in aid flows (grants and loans). Effects of technical assistance on tax/GDP ratios. Conditionality effects of aid on taxes. Stability of aid flows. 17
Table II: Heterogeneity in Aid Flows Grants Loans Technical Co- operation gdppc Additional covariate(s) ? Long-Run Aid/GDP 0.058*** [0.018] 0.013 [0.008] -0.521*** [0.029] -17.81 0.092 I(0) -0.07 (0.940) 2414 (84) 0.010 [0.018] 0.0007 [0.007] -0.517*** [0.026] -19.66 0.089 I(0) -1.60 (0.110) 2328 (84) 0.077** [0.039] 0.015 [0.018] -0.503*** [0.034] -14.98 0.085 I(0) -1.64 (0.102) 2412 (84) Short-Run Aid/GDP EC Coefficient ??? 1 ?-statistic Diagnostics RMSE Stationarity ?? test (?-value) Observations (?) Notes: *, **, and *** indicate significance at 10%, 5% and 1%. 18
Table III: Revenue Conditionality Long-Run Aid/GDP Revenue Conditionality No Revenue Conditionality 0.119*** [0.039] 0.032** [0.016] -0.483*** [0.042] -11.50 -0.006 [0.032] -0.020 [0.015] -0.519*** [0.043] -12.02 0.097 I(0) -0.69 (0.493) 830 (30) Short-Run Aid/GDP EC Coefficient ??? 1 ?-statistic Diagnostics RMSE Stationarity ?? test (?-value) Observations (?) Notes: *, **, and *** indicate significance at 10%, 5% and 1%. 0.089 I(0) 0.34 (0.731) 1539 (54) 19
Table IV: Heterogeneity in Aid Uncertainty Long-Run Aid/GDP High Aid Uncertainty Low Aid Uncertainty 0.032 [0.028] 0.014 [0.013] -0.479*** [0.046] -10.71 0.097 I(0) -1.04 (0.299) 1302 (47) 0.155*** [0.053] 0.026 [0.022] -0.502*** [0.040] -12.39 0.085 I(0) 0.78 (0.436) 1069 (37) Short-Run Aid/GDP EC Coefficient ??? 1 ?-statistic Diagnostics RMSE Stationarity ?? test (?-value) Observations (?) Notes: *, **, *** indicate significance at 10%, 5% and 1%. 20
Conclusion Tax/GDP ratios are sustained by foreign aid, and this relationship can be interpreted as a behavioural representation. Political costs of aid are greater than those for taxes. Technical assistance is equally important. Aid should be more predictable. 21
APPENDICES Poltical costs of accountability: Knack and Rahman (2007); Besley and Person (2014); Ricciuti, Savoia and Sen (2016). Bureaucratic costs of aid and taxation: Bureaucratic costs of aid: Knack and Rahman (2007); Acharya, de Lima and Moore (2007); Djankov, Montalvo and Reynal-Querol (2009). Bureaucratic costs of taxation: Moore (2014); Fossat and Bua (2013); Ahlerup, Baskaran and Bigsten (2015). 22
Weak Exogeneity (1) ? ?????= ?1?+ ?1? ??? 1+ ?=1 ?=1 ?12?? ????? ?+ ??? ?????= ?2?+ ?2? ??? 1+ ?=1 ?=1 ?22?? ????? ?+ ??? Where ??,?= the adjustment coefficients. ??? 1= the disequilibrium term constructed from the cointegrating relationship All the variables in the equations are stationary. Hence once ECMs are estimated, standard ?-ratios apply (Canning and Pedroni, 2008). ?11?? ????? ?+ ??? ? ? ?21?? ????? ?+ ??? ? 23
Weak Exogeneity (2) Weak Exogeneity tests by Canning and Pedroni (2008). ?? statistic. ?0: No long-run impact ?1: Long-run impact for a huge proportion of the panel. Results reported in table V. Net aid, grants and technical cooperation are weakly exogenous. Taxes are endogenous for long-run equilibrium. 24
Table V: Weak Exogeneity Tests Baseline Estimates Tax Equation Aid Equation Heterogeneous Aid (1) Tax Equation Grants Equation Heterogeneous Aid (2) Tax Equation Technical Assistance Equation Low Aid Uncertainty Tax Equation Aid Equation Notes: We report results for weak exogeneity from tables 1 to 6. ?? denotes the group-mean statistic which is the average of country-specific ?-ratios on the disequilibrium term which is distributed ?(0,1). We also report the robust ? ? estimate, and its associated ?-statistic. ?? (?) ?-stat Mean ? ? -1.974 -0.124 -2.114 -0.040 -2.085 -0.089 0.048 0.901 0.034 0.968 0.037 0.929 -0.493 -0.109 -0.556 -0.080 -0.586 -0.094 -12.766 -1.044 -15.044 -0.564 -14.293 -1.214 -1.882 -0.022 0.060 0.983 -0.464 -0.095 -10.526 -0.737 25
