The Dynamics of World Aquaculture and Seafood Trade
Aquaculture plays a vital role in providing essential nutrition to over one billion people globally, with more than 50% of food fish supply originating from this system. Seafood holds significant importance in international trade, surpassing all other animal proteins combined. However, challenges such as overexploitation of marine resources pose threats to future fisheries sustainability. Despite these challenges, aquaculture continues to be the fastest-growing food production system, contributing significantly to food fish supply.

Download Presentation

Please find below an Image/Link to download the presentation.
The content on the website is provided AS IS for your information and personal use only. It may not be sold, licensed, or shared on other websites without obtaining consent from the author.If you encounter any issues during the download, it is possible that the publisher has removed the file from their server.
You are allowed to download the files provided on this website for personal or commercial use, subject to the condition that they are used lawfully. All files are the property of their respective owners.
The content on the website is provided AS IS for your information and personal use only. It may not be sold, licensed, or shared on other websites without obtaining consent from the author.
E N D
Presentation Transcript
Introduction to World Aquaculture
Global Stats on Aquaculture/Seafood Seafood provides essential nutrition for over one billion people More than 37% (by volume or weight) of world fish production is traded internationally Seafood is the most globally traded protein commodity by volume and value The value of international fish trade exceeds the international trade in all other animal proteins combined Over 75%of fisheries are considered fully or over exploited More than 50% of all food fish supply comes from aquaculture Aquaculture is world s fastest growing food production system 8% annual growth
Contributions from Wild Catch and Aquaculture 250 8 Wild Catch Aquaculture World Population 7 200 Fish Consumption (million tons) Population (billions) 6 150 5 100 4 50 3 0 2 1950 1960 1970 1980 1990 2000 2005 2010 2015 est 2020
Current US Seafood Consumption (lb/capita) Top 10 Consumed Seafoods Pounds (Rank) 2010 2009 2008 4.0 (1) 4.10 (1) 4.10 (1) 2.70 (2) 2.5 (2) 2.80 (2) 2.0 (3) 2.0 (3) 1.84 (3) 1.20 (5) 1.45 (4) 1.34 (4) 0.80 (6) 0.85 (6) 0.92 (6) 1.45 (4) 1.21 (5) 1.19 (5) 0.6 (7) 0.59 (7) 0.61 (7) Species Shrimp Tuna Salmon Pollock Catfish Tilapia Crabs 2005 4.10 (1) 3.10 (2) 2.43 (3) 1.47 (4) 1.03 (5) 0.85 (6) 0.64 (7) 2000 3.20 (2) 3.50 (1) 1.58 (4) 1.59 (3) 0.99 (5) ---- 0.38 (8) Cod Clams Pangasius 0.5 (8) 0.35 (10) 0.40 (9) 0.42 (8) 0.41 (9) 0.35 (10) 0.44 (8) 0.42 (10) ---- 0.57 (8) 0.44 (9) ---- 0.75 (6) 0.47 (7) ---- Yellow => Aquaculture
Future of Marine Fisheries In trouble! Marine fisheries Over exploited or depleted resources: 25% of world marine resources 30% of highly-migratory tuna and tuna-like species 50% of highly-migratory oceanic sharks 65% of straddling and high seas resources
World Food Fish Supply (Million Tonnes) 2020 estimated Production 1970 1980 1990 2000 2007 Wild Catch 63.7 68.2 85.9 96.8 99.3 129.8 Aquaculture 3.5 7.3 16.8 45.7 55.4 103.2 Total 67.2 75.5 102.7 142.5 154.7 233.0 % from Aquaculture 5% 10% 16% 32% 36% >50% World Population (billions) 3.709 4.453 5.283 6.082 6.670 7.202 Per Capita Food Fish Supply, kg 12.1 11.3 12.9 15.6 17.0 17.1
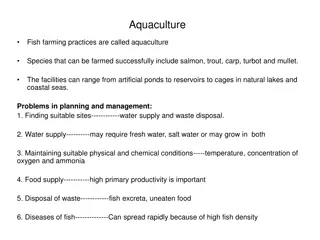
Where are the fish going to be produced? 90% of our fish is imported Low-income countries will dominate supply What are the environmental concerns? Why can t the USA compete?