Temperature Patterns Across Earth's Latitudes
Discover the temperature variations at different latitudes on Earth and understand the impact of the sun's effect on climate. Explore how temperatures change from the equator to the poles and the factors influencing these patterns. Gain insights into the diverse climates that exist due to the distribution of sunlight.

Download Presentation

Please find below an Image/Link to download the presentation.
The content on the website is provided AS IS for your information and personal use only. It may not be sold, licensed, or shared on other websites without obtaining consent from the author.If you encounter any issues during the download, it is possible that the publisher has removed the file from their server.
You are allowed to download the files provided on this website for personal or commercial use, subject to the condition that they are used lawfully. All files are the property of their respective owners.
The content on the website is provided AS IS for your information and personal use only. It may not be sold, licensed, or shared on other websites without obtaining consent from the author.
E N D
Presentation Transcript
THE SUNS EFFECT ON CLIMATE LESSON 1A What Temperature Patterns Can You Find on Earth at Different Latitudes?
The Suns Effect on Earths Climate Why is the Sun important for life on Earth?
Unit Central Question Why are some places on Earth hotter than others at different times of the year?
Lesson Focus Question What temperature patterns can you find on Earth at different latitudes?
Finding Patterns Today s focus question: What temperature patterns can you find on Earth at different latitudes? Go back to the focus question in your science notebooks and circle the word patterns. Finding patterns in temperature data will be our focus in this lesson.
What Temperature Patterns Can You Find on Earth at Different Latitudes?
What Temperature Patterns Can You Find on Earth at Different Latitudes?
Looking for Patterns in the Temperature Data 1. Work with your partner to find the temperature data for different cities on handout 1.2 (Average Temperatures around the World: January and July). 2. Record the temperature data for each city on your world maps (handout 1.3). Make sure to write the temperatures on the correct maps for January and July! 3. As you record the temperature data, pay attention to the latitude of each city. Look for any patterns in the data!
Identifying Patterns in the Data Today s focus question: What temperature patterns can you find on Earth at different latitudes? What types of patterns were you looking for in the data? What temperature patterns did you notice in the data you recorded on your world maps? Give examples of specific locations. What do you think latitude has to do the temperature patterns you observed?
Comparing Temperatures and Latitudes 1. On your world maps, look at the temperature data and latitudes for these locations: Lagos, Nigeria Jakarta, Indonesia Nome, Alaska Rothera Point, Antarctica 2. Compare the January and July data for Lagos, Nigeria, with the data for Jakarta, Indonesia. 3. Compare the January and July data for Nome, Alaska, with the data for Rothera Point, Antarctica.
Lets Summarize! What patterns do you observe in the January and July temperature data when a location is close to the equator or farther away from the equator? Complete these sentences in your science notebooks: The pattern I observe in January is _________. The pattern I observe in July is ____________. Be prepared to share your observations at the beginning of the next lesson.
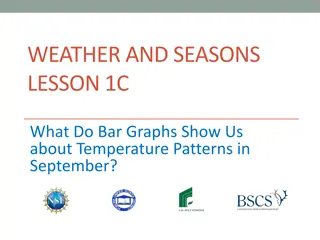
Next Time In the next lesson, we ll use bar graphs to help us see patterns in our temperature data more clearly. We ll also talk about how the time of year influences temperature patterns.