Spatial Microsimulation Methods for Small Area Estimation
Spatial Microsimulation methods
for Small Area Estimation
Dr Paul Williamson
Centre for Spatial Demographics Research
Dept. of Geography & Planning
(1) Direct survey estimation: a recap
(3) Conventional SAE: a recap
Ecological (Fay-Herriot) regression
•
Find relationship between AREA-level
Y
and
X
(s) for areas
sampled in survey
•
Assume applies to (non-sampled) areas, for which AREA-
level X is known
[ = ‘synthetic’ model-based estimate ]
E.g. ONS small area income estimates for MSOAs
•
Potential regression to the mean
•
Estimates a point in distribution; not whole distribution
Possible solutions
•
Fit separate models for separate points in the distribution
…time consuming
•
Estimate the distribution using unit level imputation or the
Empirical Best Predictor (‘World Bank’) approach
…BUT both require access to Census microdata
Known problems with conventional SAE approaches
Calibrate (reweight) survey data to fit local area constraints/margins...
...BUT weighting DOWN instead of up
= INDIRECT Survey Calibration
?
(4) ‘Spatial Microsimulation’:
an unconventional SAE approach
Spatial
Microsimulation
SAE
Calibration
Weighting
(5) Main approaches to Spatial MSM
•
I
terative
P
roportional
F
itting / Raking
•
GREGWT
(Australian Bureau of Statistics) [MCS-r plus]
•
C
ombinatorial
O
ptimisation
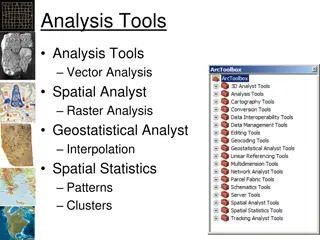
(6) A Spatial MSM example
2011 HSE ~ 10k respondents
9 benchmark tables
9 benchmark
variables
152
benchmark constraints
Estimation problem
table comprising c. 96,000 cells
(ignoring structural zeros)
(7) GREGWT v. CO
(8) IPF v. CO
Target
: Car ownership (2) x Tenure (3) (6 counts; 3%s) for residents at ward level
IPF
(9) ISC/SAE: a rapprochement?
ISC / Spatial Microsimulation is mathematically equivalent
to…?
…a GREG-like estimator (in most cases)…
…depending on the measure of fit to benchmarks and to
original weights being maximized
(a) Fitness for Purpose
If all you want is a point-estimate, then conventional
SAE techniques are generally:
•
Much easier to implement
•
Faster
•
Better understood mathematically, with known
variance etc.
HOWEVER, if you want distributional estimate, then
ISC could be a good solution
(10) The limitations of calibration
(b) Precision/bias of ISC estimates currently unknown
(b) Real vs. Integer Weight solutions
•
Integer
solutions required for:
–
lifepath modelling (dynamic microsimulation)
–
tax-benefit modelling
–
adjustment of census for under/over enumeration
•
Finding ‘optimal’ integer solution is NP-hard, so currently only
approximations are possible
(d) Software
•
Off-the-shelf solutions exist for for IPF and GREG, but can be
subject to convergence problems
•
Executable and code for CO (in Fortran) available online or on
request; or a stripped down version is available as an R
package.
(e) The value-added of ISC
x
x
x
Local prior (n=373)
Regional prior (n=10)
Geodemographic prior (n=7)
Uniform prior (n=1)
% Misclassified
(f) Local sample is usually a poor prior
Correlation of
Accommodation type
with
Ethnicity
White British
Flat
Other
Not
Flat
White British
Flat
Other
Not
Flat
Geography MORE important
(Top 7)
Geography LESS important
(Bottom 7)
…but semi-predictably…
(11) Unresolved issues
•
‘Best’ calibration weighting approach/algorithm?
•
What is the best prior?
•
‘The more constraints the better’; unless…?
•
Estimate precision/bias
Spatial microsimulation methods, as discussed by Dr. Paul Williamson, involve direct survey estimation, conventional small area estimation (SAE) approaches, and spatial microsimulation techniques. The process includes recalibrating survey data to meet local area constraints, such as ethnic and age distributions. Conventional SAE methods may encounter issues like potential regression to the mean, while spatial microsimulation offers an unconventional approach to address these challenges. This comprehensive overview delves into the nuances of estimating small area demographics and characteristics for effective planning and research.

Download Presentation

Please find below an Image/Link to download the presentation.
The content on the website is provided AS IS for your information and personal use only. It may not be sold, licensed, or shared on other websites without obtaining consent from the author.If you encounter any issues during the download, it is possible that the publisher has removed the file from their server.
You are allowed to download the files provided on this website for personal or commercial use, subject to the condition that they are used lawfully. All files are the property of their respective owners.
The content on the website is provided AS IS for your information and personal use only. It may not be sold, licensed, or shared on other websites without obtaining consent from the author.
E N D
Presentation Transcript
Spatial Microsimulation methods for Small Area Estimation Dr Paul Williamson Centre for Spatial Demographics Research Dept. of Geography & Planning
(1) Direct survey estimation: a recap Barking & Dagenham MSOA [5% of LA] [1% of LA] n 7800 5679 2705 1132 256 536 159 23 LSOA LA Pop. Attribute Person Persons aged 16-74 Males (aged 16-74) Ill Unemployed Ill Males Unemployed Males Ill Unemployed Males n 160000 113577 54099 22638 5121 10729 3174 452 n 1600 1136 541 226 51 107 32 5 Cell count < 800
(3) Conventional SAE: a recap Ecological (Fay-Herriot) regression Find relationship between AREA-level Y and X(s) for areas sampled in survey Assume applies to (non-sampled) areas, for which AREA- level X is known [ = synthetic model-based estimate ] E.g. ONS small area income estimates for MSOAs
Known problems with conventional SAE approaches Potential regression to the mean Estimates a point in distribution; not whole distribution Possible solutions Fit separate models for separate points in the distribution time consuming Estimate the distribution using unit level imputation or the Empirical Best Predictor ( World Bank ) approach BUT both require access to Census microdata
(4) Spatial Microsimulation: an unconventional SAE approach Calibrate (reweight) survey data to fit local area constraints/margins... Local ethnic distribution Local age distribution National/regional Survey distribution [age x ethnicity] ? ...BUT weighting DOWN instead of up = INDIRECT Survey Calibration
Spatial Calibration Weighting SAE Microsimulation
(5) Main approaches to Spatial MSM Iterative Proportional Fitting / Raking GREGWT (Australian Bureau of Statistics) [MCS-r plus] Combinatorial Optimisation
IPF MCS-r/GREGWT CO Avoids convergence problems Calibration weights close to initial weights No No Yes Yes Yes No Optimisation problem Min Discriminant Inf. between initial and final weights Min Chi-sq distance between initial and final weights Min TAE or RSSZ between results and benchmarks subject to exact fit to benchmarks and positive weights subject to exact fit to benchmarks and positive weights subject to positive weights Optimum Solution guaranteed? No No No Direct Integer- valued Solution Possible No No Yes
Bad Health -2.73 Good Health Reference Group Female Age:16-24 Age:25-34 Age:35-49 Age:50-64 Age:65-74 Age:75-84 Age:85+ Ethnicity: Black Ethnicity: Asian Ethnicity: Other Single Married/Civil Partnership Cohabitees Separated/Divorced Widowed Not In-Work In-Work Buying Rent/Mortgage Renting Free Ownership Education: No Qualification Education: L1 Education: L2 Education: L3 Education: L4+ Education: Apprenticeships / Other Qualifications 2nd Quintile IMD 3rd Quintile IMD 4th Quintile IMD 5th Quintile IMD: most deprived Household Reference Person Table 3. General Health Multinomial Model for England. Log-odd coefficients and significance are displayed with respect to the reference category (fair health). The reference group are males, age 0- 15, white, living in an owned household, within the lowest quintile of deprivation. For this group, marital status, in-work, and education information do not apply in the HSE 2011 survey data. ** ** ** 3.47 -0.05 0.95 0.85 -0.01 -0.54 -0.7 -0.91 -1.18 -0.02 -0.5 0.11 -0.46 -0.32 -0.32 -0.23 -0.22 -1.01 -0.54 0.05 -0.58 -0.51 -0.39 -0.56 -0.43 -0.27 -0.11 0.11 -0.28 ** -0.3 -1.5 0.27 0.64 0.76 0.13 0.39 0.05 -0.79 -0.19 0.27 0.18 0.03 0.41 0.13 -0.03 1.21 -0.47 0.32 0.38 0.5 0.14 0.19 0.3 0.02 -0.09 -0.05 0.36 ** ** 2011 HSE ~ 10k respondents ** ** ** ** ** ** * * ** ** ** ** * * ** ** ** ** * ** ** ** ** ** 0.3 0.28 0.1 0.51 -0.03 -0.16 -0.27 -0.42 -0.5 -0.13 ** ** ** *
Benchmark constraints 12 5 50 16 10 6 36 12 5 Benchmark Tables Origin by Tenure Tenure Marital status by Sex by Age Sex by Age Marital status by In-Work Education HRP Origin by Tenure by Age HRP In-Work by Tenure by Age Area IMD (deprivation) quintile Source LC4203EW QS403EW LC1108EW LC3302EW LC6401EW LC5103EW LC4201EW LC4601EW PHE table BC1. BC2. BC3. BC4. BC5. BC6. BC7. BC8. BC9. 9 benchmark tables 9 benchmark variables 152 benchmark constraints Estimation problem table comprising c. 96,000 cells (ignoring structural zeros)
Relative Error (%) Mean Linear Regression Health Deviation Intercept Slope Adj. R- squared 0.986 0.793 0.850 Good Fair Bad 3.27 20.44 14.11 2.06 16.34 13.53 -66.58 46.79 10.20 1.04 0.80 0.95
(8) IPF v. CO Target: Car ownership (2) x Tenure (3) (6 counts; 3%s) for residents at ward level Average error (RMSE) 816 wards Average error (RMSE) 9363 wards Source of relationship 6 counts 6 counts 3 %s 3 %s None 1. Independent margins 381 348 0.209 0.189 IPF 2% SAR 2. England & Wales 3. Direct SAR area sample 3a. Multilevel model 69 62 61 61 60 62 0.158 0.110 0.109 0.057 0.059 0.059 Combinatorial Optimisation 5. Direct estimate 6. As constraint on IPF Combinatorial Optimisation 5. Direct estimate 1% SAR, 26 ward types 4. Direct ward type sample 4a. Multilevel model 6. As constraint on IPF -- -- -- -- -- -- 42 0.047 -- 42 32 0.047 0.045 57 58 -- -- 32 0.093 0.093 0.045 -- -- --
(9) ISC/SAE: a rapprochement? ISC / Spatial Microsimulation is mathematically equivalent to ? a GREG-like estimator (in most cases) depending on the measure of fit to benchmarks and to original weights being maximized
(10) The limitations of calibration (a) Fitness for Purpose If all you want is a point-estimate, then conventional SAE techniques are generally: Much easier to implement Faster Better understood mathematically, with known variance etc. HOWEVER, if you want distributional estimate, then ISC could be a good solution
(b) Real vs. Integer Weight solutions Integersolutions required for: lifepath modelling (dynamic microsimulation) tax-benefit modelling adjustment of census for under/over enumeration Finding optimal integer solution is NP-hard, so currently only approximations are possible
(d) Software Off-the-shelf solutions exist for for IPF and GREG, but can be subject to convergence problems Executable and code for CO (in Fortran) available online or on request; or a stripped down version is available as an R package.
(e) The value-added of ISC Type of interaction / distribution NSA User Constrained (benchmarked) ??? ??? x Margin-constrained ?? ?? ?? ??? x x Unconstrained ??? ?
(f) Local sample is usually a poor prior Local prior (n=373) Regional prior (n=10) Geodemographic prior (n=7) Uniform prior (n=1) % Misclassified
(g) Interactions vary spatially Other White British Not Flat Flat Other White British Not Flat Flat Correlation of Accommodation type with Ethnicity
but semi-predictably Geography MORE important (Top 7) Geography LESS important (Bottom 7)
(11) Unresolved issues Best calibration weighting approach/algorithm? What is the best prior? The more constraints the better ; unless ? Estimate precision/bias

 Direct survey estimation: a recap")
 Direct survey estimation: a recap")
 Direct survey estimation: a recap")
 Direct survey estimation: a recap")
 Conventional SAE: a recap")

 ‘Spatial Microsimulation’:")
 ‘Spatial Microsimulation’:")
 ‘Spatial Microsimulation’:")

 Main approaches to Spatial MSM")

 A Spatial MSM example")


")
 GREGWT v. CO")
 IPF v. CO")
 ISC/SAE: a rapprochement?")
 The limitations of calibration")
 Precision/bias of ISC estimates currently unknown")
 Real vs. Integer Weight solutions")
 Software")
 The value-added of ISC")
 Local sample is usually a poor prior")
 Interactions vary spatially…")

 Unresolved issues")