Solving Problems Using Pie Graph Data


Yani Ansari Wuna
Exchange Student
Indonesia

Solving Routine and Non-Routine
Problems Using Data Presented in
a Pie Graph
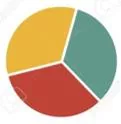

Shown below is a table of means of
transportations used by 180 people
went to their work.
Construct a pie graph using the data
presented in table above.
Use a protactor
School Fair
The problem asked for the total sales
of the following booths.
a.
Ice cream Parlor
b.
Souvenirs Items
Find what are asked in the problem
Multiplications, addition and
subtraction
Determine the operations to be used
The second question was
about the total sales of
the souvernir items booth.
To find the answer for this
question add all the sales
from food, drinks and ice
cream then substract the
sum for the total sales
For Question #1
¼ 0f 6588 = 1647
Or
25% 0f 6588
=0.25 x 6588
=1647
For Question #2
Drinks
=
₱1580
Food
=
₱2297
Ice Cream
=
₱1647
Solution for Question #2
a.
1580 + 2297 + 1647
= 5524
Solution for Question #2
b.
6588 - 5524
= 1064
The ice ceram parlor had a
total sales
₱1647
The souvernir items
booth had a total
sales
₱1064
THANK YOU
^_^
In this educational content, students learn how to solve routine and non-routine problems using data presented in pie graphs. The example scenarios involve analyzing means of transportation used by people and calculating total sales at a school fair. Step-by-step explanations guide learners through understanding the problems, determining operations, and finding solutions through calculations. This practical approach helps enhance problem-solving skills and data interpretation abilities.

Download Presentation

Please find below an Image/Link to download the presentation.
The content on the website is provided AS IS for your information and personal use only. It may not be sold, licensed, or shared on other websites without obtaining consent from the author.If you encounter any issues during the download, it is possible that the publisher has removed the file from their server.
You are allowed to download the files provided on this website for personal or commercial use, subject to the condition that they are used lawfully. All files are the property of their respective owners.
The content on the website is provided AS IS for your information and personal use only. It may not be sold, licensed, or shared on other websites without obtaining consent from the author.
E N D
Presentation Transcript
Solving Routine and Non-Routine Problems Using Data Presented in a Pie Graph PRAYER Yani Ansari Wuna Exchange Student Indonesia
the DRILL pupils. for Solves routine and routine problems using data presented in a pie graph DRILL OBJECTIVE
Shown below is a table of means of transportations used by 180 people went to their work. REVIEW Construct a pie graph using the data presented in table above. Use a protactor
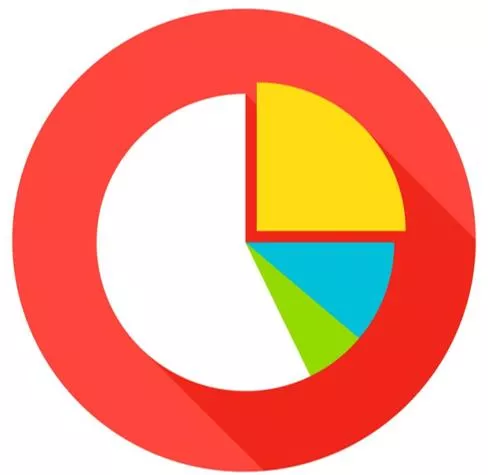
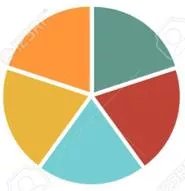
During the school fair, the school was able to raise the amount 6.588 from the sale of goods in the different booths on the first day of the event. Drinks 24% Food 35% Ice cream flavor 25% Souvenir items 35% The booth for food has a sale of 2.297 and for the drinks they had a sale of 1.580. 1. how much was the total sales of the ice cream parlor? 2. how much was the total sales of the souvenir items booth? Let us solve the problem using the following steps.
During the school fair, the school was able to raise the amount 6.588 from the sale of goods in the different booths on the first day of the event. STEP 1 Understand the problem Find what are asked in the problem Drinks 24% The problem asked for the total sales of the following booths. a. Ice cream Parlor b. Souvenirs Items Food 35% Ice cream flavor 25% Souvenir items 35% The booth for food has a sale of 2.297 and for the drinks they had a sale of 1.580. 1. how much was the total sales of the ice cream parlor? 2. how much was the total sales of the souvenir items booth? Multiplications, addition and subtraction Determine the operations to be used Let us solve the problem using the following steps.
During the school fair, the school was able to raise the amount 6.588 from the sale of goods in the different booths on the first day of the event. STEP 1 Understand the problem For Question #1 0f 6588 = 1647 Or Find what are asked in the problem The ice ceram parlor had a total sales 1647 Drinks 24% 25% 0f 6588 =0.25 x 6588 =1647 The problem asked for the total sales of the following booths. a. Ice cream Parlor b. Souvenirs Items The second question was about the total sales of the souvernir items booth. To find the answer for this question add all the sales from food, drinks and ice cream then substract the sum for the total sales Food 35% Ice cream flavor 25% For Question #2 Drinks Food Ice Cream Souvenir items 35% = 1580 = 2297 = 1647 Solution for Question #2 b. 6588 - 5524 = 1064 The booth for food has a sale of 2.297 and for the drinks they had a sale of 1.580. 1. how much was the total sales of the ice cream parlor? 2. how much was the total sales of the souvenir items booth? Multiplications, addition and subtraction a. 1580 + 2297 + 1647 = 5524 Determine the operations to be used Solution for Question #2 The souvernir items booth had a total sales 1064 Let us solve the problem using the following steps.
where this the they Application What did we do to solve the problem? Application Generalization
THANK YOU ^_^