Simulation Study of Reverse MC with Geant4 for Energy Deposition Comparison
Explore a study on Reverse Monte Carlo (MC) and space charge effect simulation using Geant4 for energy deposition comparison. The research includes efficiency comparisons, charge deposition distributions, and dose rate distributions conducted by Kang Wang from Beihang University, focusing on the validation and verification of reverse physics processes in energy deposition simulations.
Download Presentation

Please find below an Image/Link to download the presentation.
The content on the website is provided AS IS for your information and personal use only. It may not be sold, licensed, or shared on other websites without obtaining consent from the author. If you encounter any issues during the download, it is possible that the publisher has removed the file from their server.
You are allowed to download the files provided on this website for personal or commercial use, subject to the condition that they are used lawfully. All files are the property of their respective owners.
The content on the website is provided AS IS for your information and personal use only. It may not be sold, licensed, or shared on other websites without obtaining consent from the author.
E N D
Presentation Transcript
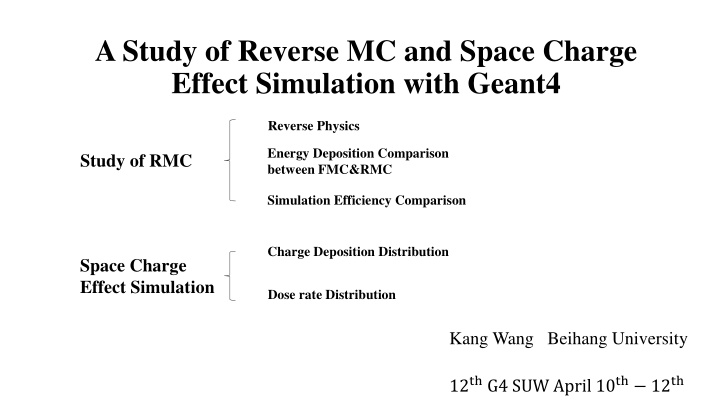
A Study of Reverse MC and Space Charge Effect Simulation with Geant4 Reverse Physics Energy Deposition Comparison between FMC&RMC Study of RMC Simulation Efficiency Comparison Charge Deposition Distribution Space Charge Effect Simulation Dose rate Distribution Kang Wang Beihang University 12thG4 SUW April 10th 12th
The Verification of Reverse Physics Process The Verification of Reverse Physics Process Geometry Si Sensitive Sphere(Radius 9.5cm) in order to get energy full deposited Spherical Al shielding(Radius 10 cm Thickness 1mm) Initial spectrum 1/E or mono Actual process Reverse process Spectrum outside Al shielding Actual process From sensitive boundary to outside Al shielding boundary to Si ball Al to Sensitive From sensitive If it is a valid event Compare RMC Energy Deposition FMC Energy Deposition
Monoenergetic Electron Deposition Spectrum Only ionization process considered in forward and reverse simulation The energy of electrons gains during the reverse process. However there still exists a fluctuation in the gain energy. Hence making the spectrum of outgoing particles obtain a 12MeV- centered peak 10MeV Monoenergetic Electron Deposition Spectrum of RMC Deposition Spectrum of FMC Conclusion of the peak in final spectrum and monoenergetic spectrum seem to be in consistency. It s the fluctuation of both energy gain and loss that cause the energy distribution. The center value Set this spectrum as the new primary spectrum for electrons. Electrons lose energies during the forward process. Again there exists a fluctuation in the loss energy. The spectrum of outgoing particles has a 10MeV-centered peak.
Deposition of Electron with 1/E Primary Spectrum Only ionization process considered in forward and reverse simulation RMC consistency, which proves the reverse ionization process does match the actual ionization process. and FMC deposition spectrum is in
Ionization & Multiple Scattering RMC Deposition Spectrum The shapes of the two spectra in the full range are a little similar in some way: Shows a Exponential decline. But when it comes to the rang of 0-1.1MeV, they are quite different, which may indicate that the reverse Multiple Scattering do not match the real process so perfectly. In the same range multiple scattering FMC Deposition Spectrum in full range FMC Deposition Spectrum
Ionization & Compton Scattering RMC Deposition Spectrum The curve seems to have a widening in FMC deposition spectrum compared to RMC. And the deviation between two peak also cannot be ignored. But they do have a similarity in the full range. So in conclusion the reverse Compton Scattering matches the actual process but not completely. In the same range FMC Deposition Spectrum in full range FMC Deposition Spectrum deviation
Energy Deposition Comparison between FMC&RMC (All the physics process included) Geometry Si Sensitive Sphere(Radius from 1mm-8cm) Cubic Al shielding(Length 20 cm Thickness 3mm) Spectrum Compare deviation of FMC and RMC deposition when Edep/Edep reaches 1%. the curve and FMC: Uniform Spectrum 1keV-10MeV;Electron RMC: Uniform Spectrum 1keV-10MeV;Electron (Outside Spectrum normalized to Uniform spectrum)
Radius = 1mm Same shape ! Radius = 5mm Different in low energy region When the radius rises, the two curves gets closer. Because electron energy nearly fully deposit. Radius = 3cm Radius = 8cm
Deviation of FMC and RMC Energy Deposition The deviation is smaller when only range 0.1-10MeV is considered. Yet it also means that the low energy region of RMC and FMC differ more. dose =DoseRMC DoseFMC =EdepRMC EdepFMC EdepFMC DoseFMC
Simulation Efficiency of RMC&FMC RMC computing efficiency is 500 times the efficiency of FMC Computing time /s Smaller sensitive detector cause bigger difference Radius of sensitive detector /cm
Space Charge Effect Simulation Motivation: There is a urgent need for the charge simulation of satellite with a complex inner structure. The existing Monte Carlo simulation is no longer appropriate according to its low efficiency, and it fails to meet the needs of space missions. In order to improve the computation efficiency, we need to find a rapid simulation for electron transport. Plan: Reverse MC under Geant4 is a rather good option since it can reduce significantly the computing time by backward tracking from the sensitive region till the external source. Desorgher L, Lei F.NIM in PRA, 2010, 621(1): 247-257.
Charge Deposition Distribution In order to calculate Charge Deposition Distribution and Dose Distribution, we divide sensitive target into small parts. The terminal points of the electron decide which part those electron finally stop in. And by counting the number of stopping electron, we can obtain the average charge increment per unit time. For example, the electron stops in PartABC. So the charge of PartABC -1e. By track the secondary particles ,the Compton Scattering and -rays is also taken into consideration. For example, if secondary is produced at E, then PartABC s charge +1e.The part in which secondary particle stops in -1e.
Dose rate Distribution For the dose rate distribution, there is a little bit different. Because we care about the dose rate near a certain point or a area, small parts is no longer suitable in this case. So we create a sphere covering the point. By calculating the inflow and Outflow energy of the sphere per unit time, we can obtain the average dose rate at or near Point B.
CollaboratorsLihua Zhu Beihang University Zhenlong Zhang NSSC(CAS) Thanks for your listening.


