Shape Properties for Object Recognition


Shapes and shape properties
Image Recognition
Matt Boutell

Why study shape properties?
Take a mask of a detected object
Consider properties like
circularity, elongation, holes,
perimeter, and centroid.
Many properties are useful…
…to describe shapes
(objects detected)
…to distinguish shapes from each
other


How to calculate shape properties?
1. Use a connected components
algorithm to isolate individual
regions
2. Use MATLAB’s regionprops
(But we’ll build some of our own
regionprops in this unit to
understand what MATLAB is doing)
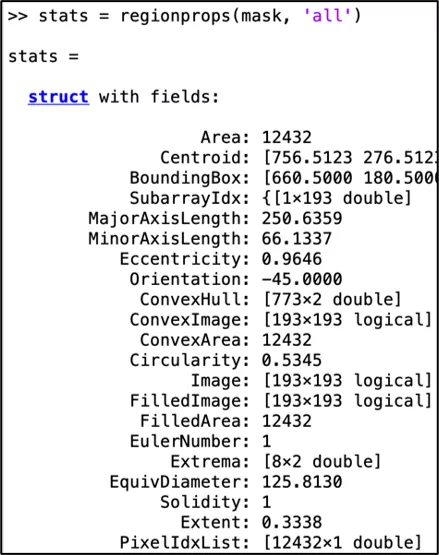
Regionprops
Region
p
rops will return stats on each region.
rect = imread('rectangles5.png');rect(find(rect > 0)) = 255; % to BW
[cc,n] = bwlabel(rect,8);
% Returns an array of stat structs
% 'All' or just those needed
allStats = regionprops(cc, 'all');
% returns stats on region 5 only
stats = regionprops(cc==5, 'all');
stats.Area
12432
stats.PixelList
12432x2 double
stats.PixelIdxList
12432 x 1 double
Some immediately useful properties, part 1: Area and Centroid
stats.Area
12432 % num pixels
stats.Centroid
756.5123 276.5123
Same as:
mean(stats.PixelList)
Or:
[r,c]=find(cc==5);
mean(r), mean(c)
BoundingBox and Extent
BoundingBox is the smallest axis-aligned rectangle that
encloses the region
(x,y)_
width
height
Some immediately useful properties, part 2: FilledImage
If holes are too big to fill with
dilation:
stats.FilledImage
fills the holes and returns the
bounding box with the filled region.
You then need to replace the
original bounding box with the filled
region. How?
Some immediately useful properties, tangent: imfill
Turns out it's easier to use
imfill
to do this since it doesn't mess with
bounding boxes.
filledImage = imfill(cc);
Some immediately useful properties, part 3: remove small
regions
Related: if noise is too big to
remove with erosion, you can turn
any region with small-enough area
to 0, like.
stats = regionprops(cc==i, ‘Area’)
if (stats.Area < th):
cc(cc==5) = 0
Euler number
Euler number is
the number of regions minus the number of holes
Useful in character recognition:
The letter
D
has an Euler number of 1-1 = 0
The letter
J
has an Euler number of 1-0 = 1
The letter
B
has an Euler number of 1-2 = -1
The letter
i
has an Euler number of ___.
Most letters have an Euler number of ____.
This image has an Euler number of ____.
Perimeter and length
Perimeter and perimeter length aren't the same
Perimeter
…i
s a set of pixels
bwperim(cc==5)
P
8
(R)
R
Perimeter is a set of pixels
Perimeter length is a number
Circularity
Circularity
Principal Axes
Principal axes give the angle and elongation of a region
Principal components analysis is a
well-known
ML technique.
1, elongation: 3.91, angle = -0.0 deg
2, elongation: 3.80, angle = -34.0 deg
3, elongation: 3.80, angle = 54.0 deg
4, elongation: 3.91, angle = -90.0 deg
5, elongation: 3.79, angle = -45.0 deg
elongation = stats(2).MajorAxisLength/stats.MinorAxisLength:
3.8016
orientation = stats(2).Orientation:
-33.9944
Intuition of PCA
Shift and rotate the axes so that
one (the principal axis) captures the
most variability.
How? The axes are the
eigenvectors
of the covariance matrix, sorted by
size of eigenvalues, largest first!
Simple for shapes, since only 2D.
It works in high dimensions too.
Example: size vs weight for a population of mammals
The new axes are
more intuitive:
The
size
axis is the
principal component:
the direction giving
greatest variability.
The
girth
axis is
perpendicular to the
size axis. It is
uncorrelated and gives
the direction of least
variability.
height
weight
Covariance matrix
We need to find the covariance matrix, C:
x
y
We need to find the covariance matrix, C:
Actual and estimated covariance matrix for various shapes
Covariance matrix using matrix calculations
Can we find the covariance matrix, C, without loops?
Eigenvalues and eigenvectors
Theorem
The eigenvectors of the covariance
matrix give the directions of
variation, sorted from the one
corresponding to the largest
eigenvalue to the one
corresponding to the smallest
eigenvalue.
Because the matrix is symmetric, the
eigenvalues are guaranteed to be
positive real numbers, and
eigenvectors are orthogonal
This discussion
leads to the Rayleigh
quotient
Recap: How to find principal axes and elongation?
Lab
Lab
Could you use the region properties we’ve studied to
distinguish different shapes (squares, rectangles, circles,
ellipses, triangles, …)?
Both
The importance of studying shape properties for object recognition in image processing. Learn how properties like circularity, elongation, holes, perimeter, and centroid help in distinguishing shapes. Discover how to calculate shape properties using connected components algorithms and MATLAB's regionprops function. Dive into regionprops to retrieve statistics on each region, such as area and centroid. Understand concepts like bounding box, extent, and filled image in the context of shape analysis.

Download Presentation

Please find below an Image/Link to download the presentation.
The content on the website is provided AS IS for your information and personal use only. It may not be sold, licensed, or shared on other websites without obtaining consent from the author.If you encounter any issues during the download, it is possible that the publisher has removed the file from their server.
You are allowed to download the files provided on this website for personal or commercial use, subject to the condition that they are used lawfully. All files are the property of their respective owners.
The content on the website is provided AS IS for your information and personal use only. It may not be sold, licensed, or shared on other websites without obtaining consent from the author.
E N D
Presentation Transcript
Shapes and shape properties Image Recognition Matt Boutell
Why study shape properties? Take a mask of a detected object Consider properties like circularity, elongation, holes, perimeter, and centroid. Many properties are useful to describe shapes (objects detected) to distinguish shapes from each other
How to calculate shape properties? 1. Use a connected components algorithm to isolate individual regions 2. Use MATLAB s regionprops (But we ll build some of our own regionprops in this unit to understand what MATLAB is doing)
Regionprops will return stats on each region. rect = imread('rectangles5.png'); rect(find(rect > 0)) = 255; % to BW [cc,n] = bwlabel(rect,8); % Returns an array of stat structs % 'All' or just those needed allStats = regionprops(cc, 'all'); % returns stats on region 5 only stats = regionprops(cc==5, 'all'); stats.Area 12432 stats.PixelList 12432x2 double stats.PixelIdxList 12432 x 1 double
Some immediately useful properties, part 1: Area and Centroid stats.Area 12432 % num pixels stats.Centroid 756.5123 276.5123 Same as: mean(stats.PixelList) Or: [r,c]=find(cc==5); mean(r), mean(c)
BoundingBox is the smallest axis-aligned rectangle that encloses the region It always touches a pixel on each side of the region. Described by [x,y,width,height] (x,y)_ height width Useful to focus processing on the region. Related idea: Extent is the fraction of the bounding box that the region takes up: ?????? =?????????? ??????
Some immediately useful properties, part 2: FilledImage If holes are too big to fill with dilation: stats.FilledImage fills the holes and returns the bounding box with the filled region. You then need to replace the original bounding box with the filled region. How?
Some immediately useful properties, tangent: imfill Turns out it's easier to use imfill to do this since it doesn't mess with bounding boxes. filledImage = imfill(cc);
Some immediately useful properties, part 3: remove small regions Related: if noise is too big to remove with erosion, you can turn any region with small-enough area to 0, like. stats = regionprops(cc==i, Area ) if (stats.Area < th): cc(cc==5) = 0
Euler number is the number of regions minus the number of holes Useful in character recognition: The letter D has an Euler number of 1-1 = 0 The letter J has an Euler number of 1-0 = 1 The letter B has an Euler number of 1-2 = -1 The letter i has an Euler number of ___. Most letters have an Euler number of ____. This image has an Euler number of ____.
Perimeter and perimeter length aren't the same Perimeter length is a number Perimeter is a set of pixels [r,c]=bwtraceboundary(mask) % Loop and add 1 or 2 for each pair of pixels. bwperim(cc==5) P8(R) R PL8(R), or |P8(R)|, = 6 + 3 2
Perimeter is a set of pixels Perimeter (assuming no holes) is the set of interior border pixels: If we are asked for the "8-connected perimeter", we expect the perimeter pixels to contain diagonals. Definition: ?8(?) = (?,?) ?|?4?,? ? Words: In P8(region), the border pixels are connected with the background using a 4-neighborhood. To get P8in MATLAB, use bwperim(region, 4); The definition for P4is dual to P8. The weird, "pass in 4 to get P8" and vice-versa is only for the bwperim function.
Perimeter length is a number [r,c]=bwtraceboundary(cc==5, & other params) % Gives a list of rows and columns of the boundary: r=[3,4,5,5,5,4,3,3,2,3] c=[2,3,3,4,5,5,5,6,3,2] Then loop. Add 1 or 2 for each pair of pixels: if (r(i), c(i)) and (r(i+1), c(i+1)) are 4-neighbors, add 1 else add 2
Circularity For an ? ? square, C= A circle has maximal area for a given perimeter. So take P/A. Actually ? =4?? For a 10x1 rectangle, C= ?2 For a circle, C= For a C-shape, C= Roundoff is a problem on small shapes, like 3x3 square
Principal axes give the angle and elongation of a region Principal components analysis is a well-known ML technique. 1, elongation: 3.91, angle = -0.0 deg 2, elongation: 3.80, angle = -34.0 deg 3, elongation: 3.80, angle = 54.0 deg 4, elongation: 3.91, angle = -90.0 deg 5, elongation: 3.79, angle = -45.0 deg elongation = stats(2).MajorAxisLength/stats.MinorAxisLength: 3.8016 orientation = stats(2).Orientation: -33.9944
Intuition of PCA Shift and rotate the axes so that one (the principal axis) captures the most variability. How? The axes are the eigenvectors of the covariance matrix, sorted by size of eigenvalues, largest first! Simple for shapes, since only 2D. It works in high dimensions too.
Example: size vs weight for a population of mammals The new axes are more intuitive: The size axis is the principal component: the direction giving greatest variability. size weight girth The girth axis is perpendicular to the size axis. It is uncorrelated and gives the direction of least variability. height
We need to find the covariance matrix, C: ??? ??? ??? ??? ? = ? ???=1 y ? ?=1 (?? ?)(?? ?) ? ???=1 ? ?=1 (?? ?)(?? ?) ? ???=1 ? ?=1 ???= ??? (?? ?)(?? ?) x
We need to find the covariance matrix, C: ??? ??? ??? ??? ? ? ? = ? ???=1 ? ?=1 (?? ?)(?? ?) x ? ? ???=1 ? ?=1 (?? ?)(?? ?) ? ???=1 ? ?=1 ???= ??? (?? ?)(?? ?)
Actual and estimated covariance matrix for various shapes ?1=14,258,160 0 0 924,140 Why should we expect ?1=? 0 0 ?,? ??? ? > ? > 0? ?2=15,211,000 2,098,000 2,098,000 1,392,000 ?3=8,376,490 7,284,670 7,284,670 8,376,490 ?4=924,140 0 0 14,258,160
Can we find the covariance matrix, C, without loops? ??? ??? ??? ??? Put points in a matrix ? = ?1 ?? ?1 ?? ? = ? ???=1 ? ?=1 (?? ?)(?? ?) Subtract off the mean: ?1 ? ? ?1 ? ?? ? ???=1 ? ?=1 (?? ?)(?? ?) ? = ?? ? ? ???=1 Then C= ? ?=1 ???= ??? (?? ?)(?? ?) 1 ????
Theorem The eigenvectors of the covariance matrix give the directions of variation, sorted from the one corresponding to the largest eigenvalue to the one corresponding to the smallest eigenvalue. Because the matrix is symmetric, the eigenvalues are guaranteed to be positive real numbers, and eigenvectors are orthogonal This discussion leads to the Rayleigh quotient ??? ??? ??? ??? ? = Solve ?? = ??
Recap: How to find principal axes and elongation? ??? ??? ??? ??? 1. Calculate spatial covariance matrix, ? = and columns instead of x and y). 2. Find eigenvalues, ?1, ?2, and eigenvectors, ?1, ?2. (use rows 3. The principal axis is the eigenvector corresponding to largest eigenvalue, ????. Direction is the vector, angle from ??? 1if requested. 4. And elongation, the aspect ratio of the shape's length and ???? ???? width along the axes, is for eigenvalues ?.
Lab Could you use the region properties we ve studied to distinguish different shapes (squares, rectangles, circles, ellipses, triangles, )?