Satellite Time-Series Analysis for Ecosystem Monitoring in ECOPOTENTIAL Project
This project, part of HORIZON2020 and ERA-PLANET, focuses on satellite time-series analysis for ecosystem monitoring at regional to continental scales. It aims to improve ecosystem benefits through Earth Observation data, contributing to UN Sustainable Development Goal 15 by protecting, restoring, and promoting sustainable use of terrestrial ecosystems. The project involves monitoring ecosystem extent and functioning, modeling macro-systems ecology, and transitioning from the web of data to knowledge through a Virtual Laboratory platform. It addresses challenges like land degradation, biodiversity loss, and habitat conservation using a combination of satellite data and advanced analysis techniques.
Download Presentation

Please find below an Image/Link to download the presentation.
The content on the website is provided AS IS for your information and personal use only. It may not be sold, licensed, or shared on other websites without obtaining consent from the author.If you encounter any issues during the download, it is possible that the publisher has removed the file from their server.
You are allowed to download the files provided on this website for personal or commercial use, subject to the condition that they are used lawfully. All files are the property of their respective owners.
The content on the website is provided AS IS for your information and personal use only. It may not be sold, licensed, or shared on other websites without obtaining consent from the author.
E N D
Presentation Transcript
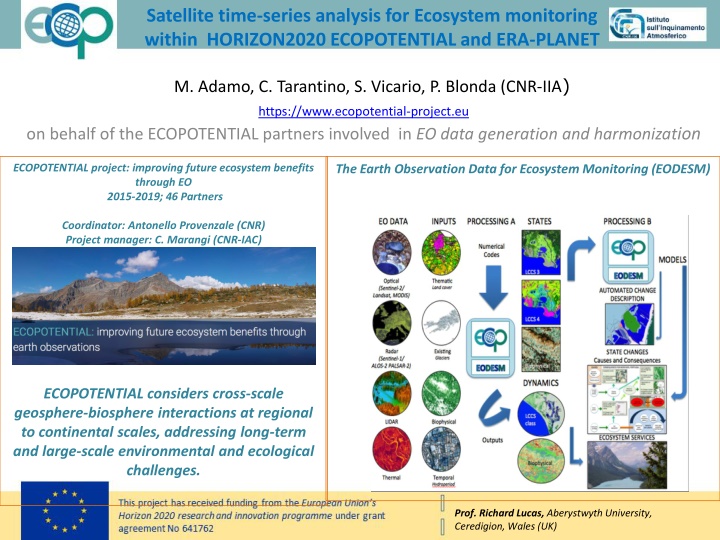
Satellite time-series analysis for Ecosystem monitoring within HORIZON2020 ECOPOTENTIAL and ERA-PLANET M. Adamo, C. Tarantino, S. Vicario, P. Blonda (CNR-IIA) https://www.ecopotential-project.eu on behalf of the ECOPOTENTIAL partners involved in EO data generation and harmonization ECOPOTENTIAL project: improving future ecosystem benefits through EO 2015-2019; 46 Partners The Earth Observation Data for Ecosystem Monitoring (EODESM) Coordinator: Antonello Provenzale (CNR) Project manager: C. Marangi (CNR-IAC) ECOPOTENTIAL considers cross-scale geosphere-biosphere interactions at regional to continental scales, addressing long-term and large-scale environmental and ecological challenges. Prof. Richard Lucas, Aberystwyth University, Ceredigion, Wales (UK)
The project contribution to the engagement priorities of UN Sustainable Development Goal (SDG) 15 Goal 15: Protect, restore and promote sustainable use of terrestrial ecosystems, , halt and reverse land degradation and biodiversity loss Production and dissemination of new knowledge for informed decision making by: Monitoring: EVs, Ecosystem extent and functioning, and changes through the Earth Observation Data for EcoSystem Monitoring (EODESM) system Modelling: Macro-systems Ecology and scenario analysis for future Protected Areas protections Fostering the transition from the web of data to the web of knowledge: Models and services are fed into the Virtual Laboratory (VL) platform Developing a community of practices. It involves researchers, PA managers, and policy makers
Virtual Laboratory (VL): from data to knowlegde Knowledge bases EO products EO Infrastructure Datasets ECOPOTENTIAL VLAB Long-term preservation archives EODESM Workflow VLab VLab APIs EODESM Source code Portal and apps Remote processing services Credits: P. Mazzetti (CNR). WP10 VLAB End User The project virtual environment to facilitate the activities in the ecosystem community-of-practice
Natural grasslands ecosystem in Murgia Alta Threaths Rock graining in natural grasslands for agriculture purposes: land degradation; Ailanthus altissima invasion; Users requirements Grasslands habitats (i.e., 6210; 62A0; 6220) extent and Conservation status Changes Sentinel-2 data intra-annual time series Landsat time series 2010-2018; Multi-seasonal Worlview-2/3 imagery
Data Cube in the ftp RECAS site Inter and intra-annual time series (TS) of Copernicus data for semi- operational to operational: a) LC mapping when the lack of information layers and ground truth data may hamper EODESM classification and subsequent habitat mapping; b) Multi-temporal change detection in LC and Essential Variables (e.g., GPP); c) Evaluation of management policies effectiveness, e.g., eradication of A. Altissima.
LC mapping from intra-annual Landsat time series Land Cover map (2017) FAO-LCCS Taxonomy OA=85.8% 1.71% A11/A1A7A10 Cultivated/TreesBroadleavedDeciduous A11/A1A7A9 Cultivated/TreesBroadleavedEvergreen A11/A2A7A10 Cultivated/ShrubsBroadleavedDeciduous A11/A3 Cultivated/Herbaceous A12/A1D1E1 Natural/BroadleavedEvergreen A12/A1D1E2 Natural/BroadleavedDeciduous A12/A1D2E1 Natural/NeedleleavedEvergreen A12/A2A6 Natural/HerbaceousGraminoids B15 Artificial Surfaces B28/A1A5 Natural/WaterStading Grasslands mapping recognized with high accuracy (F1 score 90%) F1 score= 2 ???? ? ???????? ? ???? ?+???????? ? Most grasslands misclassification with A11/A3 (cultivated herbaceous) and B15 (mainly extraction sites, abandoned land) 1:900.000 IV ECOPOTENTIAL General Meeting Rome, 20-24 May 2019
From LC to Habitats 6210 62A0 6220 (Hyparrhenia hirta) Can phenology from intra-annual TS help in habitat discrimination? Reference fields available for natural grasslands Annex 1 habitats: 6210 Semi-natural dry grasslands and scrubland facies on calcareous substrates (Festuco-Brometalia) 62A0 Eastern submediterranean dry grasslands (Scorzoneretalia villosae) 6220 Pseudo-steppe with grasses and annuals of the Thero-Brachypodietea (Hyparrhenia hirta) IV ECOPOTENTIAL General Meeting Rome, 20-24 May 2019
INTRA_ANNUAL: Habitat mapping flow chart INPUT MSAVI: Modified Soil Adjusted Vegetation Index Intra-annua MSAVI TS from 26 Landsat L2A images, 2017 SVM INPUT: Natural LC map 2017 10-classes reference LC data Grasslands layer SVM INPUT: Habitat map 4-classes reference habitat data Radial Basis Function (RBF) as kernel function
1. Habitat mapping from inter-annual Sentinel-2 SVM classifier OA(%)=96.97 1.62 Annex 1 HABITAT 6210 62A0 6220-Hyparrhenia hirta Other Future work: Multiple input spectral indexes from both Landsat and Sentinel-2 data 1:700.000
2. Inter and Intra-annual time series for change Issue: no change ground truth available for change maps validation Proposed solution: Convergence of evidence from different change detection algorithms: a) Cross Correlation Analysis (CCA) between one map and a recent image (where?); b) Post Classification Comparison (PCC) of two supervised classified maps (from-to); c) Breaks For Additive Season and Trend (BFAST) analysis of Landsat TS (when?) IV ECOPOTENTIAL General Meeting Rome, 20-24 May 2019
2. 1 Change CCA: 2011-2017 Landsat 8 image (T2=2017) Natural Grasslands from LC map (T1=2011) 1:1.000.000 Area Natural Grasslands (2011) (km2) 5300 1350 290 217 AOI PA Copernicus Natural Grasslands layer Change map from CCA (2011-2017, TH= 1 ) August 2017 False colour composite: band 4, band 5, band 2. %Change of Natural Grasslands 9.31 21.5 Within PA Changes from Natural Grasslands to Other Within a buffer of 10 km around PA No Changes/Not considered area
2.2 Change PCC: 2011-2017 input LC maps LC map (T1=2011) LC map (T2=2017) OA=85.8% 1.71% OA=93.1% 1.24% 1:900.000 FAO-LCCS Taxonomy A11/A1A7A10 Cultivated/TreesBroadleavedDeciduous A11/A1A7A9 Cultivated/TreesBroadleavedEvergreen A11/A2A7A10 Cultivated/ShrubsBroadleavedDeciduous A11/A3 Cultivated/Herbaceous A12/A1D1E1 Natural/BroadleavedEvergreen A12/A1D1E2 Natural/BroadleavedDeciduous A12/A1D2E1 Natural/NeedleleavedEvergreen A12/A2A6 Natural/HerbaceousGraminoids B15 Artificial Surfaces B28/A1A5 Natural/WaterStading IV ECOPOTENTIAL General Meeting Rome, 20-24 May 2019
PCC (2011-2017) output change map GRASSLANDS TRANSITIONS INTO: OA=OAT1.OAT2=79.9% A11/A1A7A10 Cultivated/TreesBroadleavedDeciduous A11/A1A7A9 Cultivated/TreesBroadleavedEvergreen A11/A2A7A10 Cultivated/ShrubsBroadleavedDeciduous A11/A3 Cultivated/Herbaceous A12/A1D1E1Natural/BroadleavedEvergreen A12/A1D1E2 Natural/BroadleavedDeciduous A12/A1D2E1 Natural/NeedleleavedEvergreen B15 Artificial Surfaces NO CHANGE %Change of Natural Grasslands 56.35 80.05 Within PA Within a buffer 10 km around PA Change map from PCC (2011-2017) From-to class transitions are detected 1:700.000 IV ECOPOTENTIAL General Meeting Rome, 20-24 May 2019
Convergence of evidence %Change of Natural Grasslands PCC overestimation of grasslands transition to Cultivated/Herbaceous (A11/A3) may be due to misclassifications in the 2 input LC maps; Intersection PCC-CCA CCA PCC 6.9 18.3 9.31 21.5 56.35 80.05 Within PA Within a buffer 10 km around PA From-To? Convergence of evidence between PCC and CCA can reduce this overestimation. Grasslands change in CCA and not in PCC IV ECOPOTENTIAL General Meeting Rome, 20-24 May 2019
BFAST analysis of 296 inter- annual Landsat time series EODESM long-term analysis: Breaks For Additive Season and Trend (BFAST) Seasonality for forested area: Natural? Vegeta on:? Trees? closed? canopy? (>70-60? %)? tall? (14-30? m)? con nuous? broadleaved? evergreen? ? Trees? Cul vated:? Herbaceous? single? crop? rainfed? Deforesta on? (Breakpoint)? Cul va on? (Stable? Change)? Break point Natural? Vegeta on:? ? Graminoids? ? open? canopy? (40-20-20-10? %)? ? short? (0.8-03? m)? mixed? with? forbs? Natural? Veg:? ? Shrubs/Trees? Cover? and? height? variables? con nuous? broadleaved? evergreen? Trees? Trees? Bare? Uncon.? ? States? Trend: Deforestation to regrowth D? Regrowth? (Process)?
BFAST: 2010-2018 time series BFAST was finally applied to pixels identified as changes by both PCC and CCA: BFAST recognizes most of such changes in the Trend component 10% no change; 40% with 1 change; 50% with 2 change 30% changes in 2013; 20% changes in 2014; 40% changes in 2015 Distributed over time : When?
Close-up 2 September, 5th 2011 September, 25th 2013 May, 30th 2015 July, 20th 2018 August, 26th 2017 GRASSLANDS TRANSITIONS INTO: A11/A1A7A10 Cultivated/TreesBroadleavedDeciduous A11/A1A7A9 Cultivated/TreesBroadleavedEvergreen A11/A2A7A10 Cultivated/ShrubsBroadleavedDeciduous A11/A3 Cultivated/Herbaceous A12/A1D1E1Natural/BroadleavedEvergreen A12/A1D1E2 Natural/BroadleavedDeciduous A12/A1D2E1 Natural/NeedleleavedEvergreen B15 Artificial Surfaces NO CHANGE LC map 2011 LC map 2017 Grassland -> cultivated transition 1:10.000 IV ECOPOTENTIAL General Meeting Rome, 20-24 May 2019
Close-up 2 May, 13th 2010 September, 25th 2013 May, 30th 2015 July, 20th 2018 August, 26th 2017 LEGEND CHANGE GRASSLANDS TRANSITIONS INTO: A11/A1A7A10 A11/A1A7A9 A11/A2A7A10 A11/A3 A12/A1D1E1 A12/A1D1E2 A12/A1D2E1 B15 NO CHANGE Changes from Natural Grasslands to Other No Changes/Not considered area Grassland -> extraction site transition LC map 2011 LC map 2017 Change from CCA 2011-2017 1:10.000 IV ECOPOTENTIAL General Meeting Rome, 20-24 May 2019
Thanks for your attention!!!


