San Joaquin Valley Demographics
San Joaquin Valley Demographics
San Joaquin Valley Demographics
Overweight and Obesity by Age Group,
San Joaquin Valley and California, 2001 and 2009*
No data = Estimate is less than 500 people
Note that all data are statistically unstable
Q: in past year how many times you have been in a physical fight with a guy or girl, or a
group of people around your age?"
Number of teens in up to 3 physical fights in past year
Substantiated Cases of Child Abuse and
Neglect, by Age: 2011
Fresno
Kern
Kings
Madera
Source: Kidsdata.org, 2011
http://www.kidsdata.org/data/region/dashboard.aspx?loc=359&cat=1
Merced
SJ
Stanislaus
Tulare
Substantiated Cases of Child Abuse and
Neglect, by Age: 2011
Source: Kidsdata.org, 2011
http://www.kidsdata.org/data/region/dashboard.aspx?loc=359&cat=1
Five Leading Causes of Death in 2010
Source : CDPH Vital Statistics Death Statistical Master files
Prepared by: California Department of Public Health. Safe and Active Communities Branch
Report generated from-
http://epicenter.cdph.ca.gov
on August 10, 2012
Caution: Injury data are coded to the ICD- classification system, except for death after 1998, which are coded to the ICD-10. To avoid making invalid comparison see Help with ICD-9 and ICD-10 codes.
Rate= per 100,000
This data presents a comprehensive overview of the demographics, population statistics, personal income, education levels, unemployment rates, and health indicators of the San Joaquin Valley in California. It includes detailed information on population distribution, ethnic diversity, age groups, obesity rates, physical activity levels, and transportation habits for various counties in the region.

Download Presentation

Please find below an Image/Link to download the presentation.
The content on the website is provided AS IS for your information and personal use only. It may not be sold, licensed, or shared on other websites without obtaining consent from the author.If you encounter any issues during the download, it is possible that the publisher has removed the file from their server.
You are allowed to download the files provided on this website for personal or commercial use, subject to the condition that they are used lawfully. All files are the property of their respective owners.
The content on the website is provided AS IS for your information and personal use only. It may not be sold, licensed, or shared on other websites without obtaining consent from the author.
E N D
Presentation Transcript
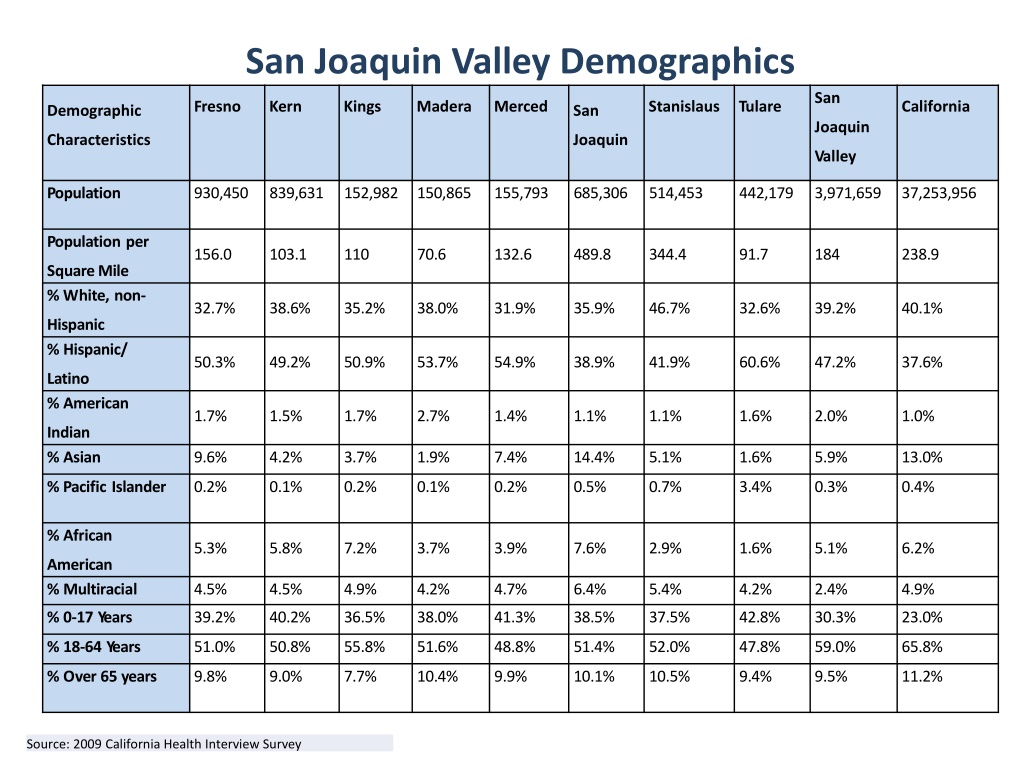
San Joaquin Valley Demographics San Fresno Kern Kings Madera Merced Stanislaus Tulare California Demographic San Joaquin Characteristics Joaquin Valley Population 930,450 839,631 152,982 150,865 155,793 685,306 514,453 442,179 3,971,659 37,253,956 Population per 156.0 103.1 110 70.6 132.6 489.8 344.4 91.7 184 238.9 SquareMile % White, non- 32.7% 38.6% 35.2% 38.0% 31.9% 35.9% 46.7% 32.6% 39.2% 40.1% Hispanic % Hispanic/ 50.3% 49.2% 50.9% 53.7% 54.9% 38.9% 41.9% 60.6% 47.2% 37.6% Latino % American 1.7% 1.5% 1.7% 2.7% 1.4% 1.1% 1.1% 1.6% 2.0% 1.0% Indian % Asian 9.6% 4.2% 3.7% 1.9% 7.4% 14.4% 5.1% 1.6% 5.9% 13.0% % Pacific Islander 0.2% 0.1% 0.2% 0.1% 0.2% 0.5% 0.7% 3.4% 0.3% 0.4% % African 5.3% 5.8% 7.2% 3.7% 3.9% 7.6% 2.9% 1.6% 5.1% 6.2% American % Multiracial 4.5% 4.5% 4.9% 4.2% 4.7% 6.4% 5.4% 4.2% 2.4% 4.9% % 0-17 Years 39.2% 40.2% 36.5% 38.0% 41.3% 38.5% 37.5% 42.8% 30.3% 23.0% % 18-64 Years 51.0% 50.8% 55.8% 51.6% 48.8% 51.4% 52.0% 47.8% 59.0% 65.8% % Over 65 years 9.8% 9.0% 7.7% 10.4% 9.9% 10.1% 10.5% 9.4% 9.5% 11.2% Source: 2009 California Health Interview Survey
San Joaquin Valley Demographics San Joaquin Valley Fresno Kern Kings Madera Merced San Joaquin Stanislaus Tulare California Demographic Characteristics Per Capita $30,997 $30,047 $26,734 $26,524 $27,871 $31,547 $31,485 $28,610 $29,227 $42,325 Personal Income % 25 years without High SchoolDiploma 26.8% 29.8% 30.8% 31.4% 33.7% 24.3% 24.8% 32.4% 29.3% 19.7% Annual 15.1% 14.4% 14.6% 13.8% 17.2% 15.4% 16.0% 18.4% 15.6% 11.4% Unemployment Rate % of Total 27.8.0% 25.4.7% 26.9% 23.6% 24.4% 23.5% 17.2% 27.7% 24.7% 17.8% Population Below 100% of FPL % of Children Under 18,in Families with Income Below 100% of the FPL 34.3% 35.5% 34.0% 35.2% 36.5% 48.3% 38.5% 40.1% 38.1% 33.9% Source: 2009 California Health Interview Survey
Overweight and Obesity by Age Group, San Joaquin Valley and California, 2001 and 2009* Ages 12-17 Ages 18-64 Ages 65+ County 2001 2009 2001 2009 2001 2009 Fresno 14.1% 24.7% 65.0% 63.3% 55.3% 71.0% Kern 7.7%* 6.5%* 61.4% 60.0% 50.8% 63.8% Kings 16.3% 17.7%* 63.5% 64.8% 58.0% 74.9% Madera 11.5%* 27.1%* 66.1% 67.6% 58.6% 71.4% Merced 18.2%* 17.1%* 67.4% 67.6% 67.2% 70.8% San Joaquin 17.9% 15.0%* 66.9% 65.6% 62.3% 65.9% Stanislaus 12.9%* 17.0%* 62.8% 64.7% 53.4% 60.2% Tulare 7.6%* 20.7%* 71.0% 68.3% 56.1% 70.3% SJV 12.8% 17.2% 65.1% 64.2% 56.5% 67.3% California Healthy People 2010 Objective 12.2% 13.3% 55.0% 57.2% 54.3% 60.4% 5.0% 5.0% 15.0% 15.0% 15.0% 15.0% Source: UCLA Center for Health Policy Research, 2003; 2009. * Statistically unstable
Percent number of days teens are physically active at least one hour (typical week) 60 56.2 50 45.3 41.5 40.9 38.5 40 36.8 35.2 34.8 33.3 30 20 10 0 Fresno Kern SJ Stanislaus Tulare Merced Kings Madera Region Source: 2009 California Health Interview Survey
Percent adults walked for transportation, fun, exercise 74 73.6 73.5 73 72.9 73 72.6 72.5 72.1 72 71.6 71.5 71.5 71 70.5 70.4 70.5 70 69.5 69 68.5 Fresno Kern SJ Stanislaus Tulare Merced Kings Madera Region Source: 2009 California Health Interview Survey
Percent all ages ever diagnosed with asthma 25 20 19.6 20 18 17.4 17 17 16 15.7 15.6 15 10 5 0 Fresno Kern SJ Stanislaus Tulare Merced Kings Madera Region Source: 2009 California Health Interview Survey
Percent school days missed due to asthma in past 12 months 35 30 25 20 1-4 days 5-10 days 15 11 or more days 10 5 0 Fresno Kern SJ Stanislaus Tulare Merced Kings Madera Region Source: 2009 California Health Interview Survey No data = Estimate is less than 500 people Note that all data are statistically unstable
Percent adults ever diagnosed with diabetes 14 13 12.3 12 11.6 12 10 9 8 7.6 8 7 6.5 6 4 2 0 Fresno Kern SJ Stanislaus Tulare Merced Kings Madera Region Source: 2009 California Health Interview Survey
Percent adults ever told has pre- or borderline diabetes 14 12.6 11.6 12 9.4 10 9 8.7 8.3 7.9 8 5.8 5.5 6 4 2 0 Fresno Kern SJ Stanislaus Tulare Merced Kings Madera Region Source: 2009 California Health Interview Survey
Percent teens in up to 3 physical fights in past year 100% 99.80% 99.60% 99% 100% 97.20% 98% 96.60% 94.90% 96% 94% 94% 91.80% 92% 90% 88% 86% Fresno Kern SJ Stanislaus Tulare Merced Kings Madera Region Number of teens in up to 3 physical fights in past year Fresno Kern SJ Stanislaus Tulare Merced Kings Madera Region 94,000 81,000 66,000 55,000 45,000 25,000 16,000 16,000 397,000 Q: in past year how many times you have been in a physical fight with a guy or girl, or a group of people around your age?" Source: 2007 California Health Interview Survey
Substantiated Cases of Child Abuse and Neglect, by Age: 2011 Kings Madera Kern Fresno Source: Kidsdata.org, 2011 http://www.kidsdata.org/data/region/dashboard.aspx?loc=359&cat=1
Substantiated Cases of Child Abuse and Neglect, by Age: 2011 Stanislaus Merced SJ Tulare Source: Kidsdata.org, 2011 http://www.kidsdata.org/data/region/dashboard.aspx?loc=359&cat=1
Percent Teen Pregancy (age 10-19) 33.1% 0.35 29.4% 29.2% 0.3 25.4% 23.8% 0.25 21.9% 21.5% 20.8% 20.1% 0.2 0.15 0.1 0.05 0 Fresno Kern SJ Stanislaus Tulare Merced Kings Madera Region
Five Leading Causes of Death in 2010 Fresno pop: 983,478 Kern pop: 871,728 Kings pop: 164,535 Madera pop: 162,111 Merced pop: 273,935 San Joaquin pop: 741,417 Stanislaus pop: 559,708 Tulare pop: 466,893 Cause of Injury Unintentional - Poisoning Number of Injuries Rate* Suicide/ Self-Inflicted 113 11.5 132 15.1 15 9.1 14 8.6 26 9.5 126 17.0 85 15.2 30 6.4 Number of Injuries Rate Homicide/Assault 66 6.7 81 9.3 10 6.1 25 15.4 26 9.5 62 8.4 50 8.9 45 9.6 Number of Injuries Rate 64 6.5 81 9.3 7 4.3 11 6.8 25 9.1 64 8.6 30 5.4 37 7.9 Unintentional - MVT, Occupant Number of Injuries Rate 43 4.4 39 4.5 6 3.6 9 5.6 6 2.2 N/A N/A N/A N/A N/A N/A Unintentional - Fall Number of Injuries 37 31 N/A 15 22 41 23 16 Rate Unintentional - MVT, Unspecified 3.8 3.6 N/A 9.3 8.0 5.5 4.1 3.4 Number of Injuries Rate N/A N/A 28 3.2 9 5.5 11 6.8 10 3.7 56 7.6 18 3.2 44 9.4 Source : CDPH Vital Statistics Death Statistical Master files Prepared by: California Department of Public Health. Safe and Active Communities Branch Report generated from- http://epicenter.cdph.ca.gov on August 10, 2012 Caution: Injury data are coded to the ICD- classification system, except for death after 1998, which are coded to the ICD-10. To avoid making invalid comparison see Help with ICD-9 and ICD-10 codes. Rate= per 100,000


")

![(❤Read⚡) [✔PDF✔] The Best Travel Guide - San Diego: A Cicerone’s View of To](/thumb/68088/read-pdf-the-best-travel-guide-san-diego-a-cicerone-s-view-of-to.jpg)