Sampling: Importance, Process, and Errors Explained
This content delves into the world of sampling, exploring why sampling is crucial, the sampling process involving defining populations and calculating sample sizes, and the distinction between non-sampling and sampling errors. It covers the significance of representative samples, common errors in sampling, and the calculation of sample sizes for research projects, offering insights into the intricate realm of data collection methodologies.

Download Presentation

Please find below an Image/Link to download the presentation.
The content on the website is provided AS IS for your information and personal use only. It may not be sold, licensed, or shared on other websites without obtaining consent from the author.If you encounter any issues during the download, it is possible that the publisher has removed the file from their server.
You are allowed to download the files provided on this website for personal or commercial use, subject to the condition that they are used lawfully. All files are the property of their respective owners.
The content on the website is provided AS IS for your information and personal use only. It may not be sold, licensed, or shared on other websites without obtaining consent from the author.
E N D
Presentation Transcript
CAIP Canada Exam Prep Seminar: Sampling ROBERT A. G. WONG, CAIP, FCRIC MAY 2020
Sampling: A Mystery Why sample? Sampling process Four steps Defining population Identify sample frame Calculating sample size Applying sampling procedures Non-probability Probability
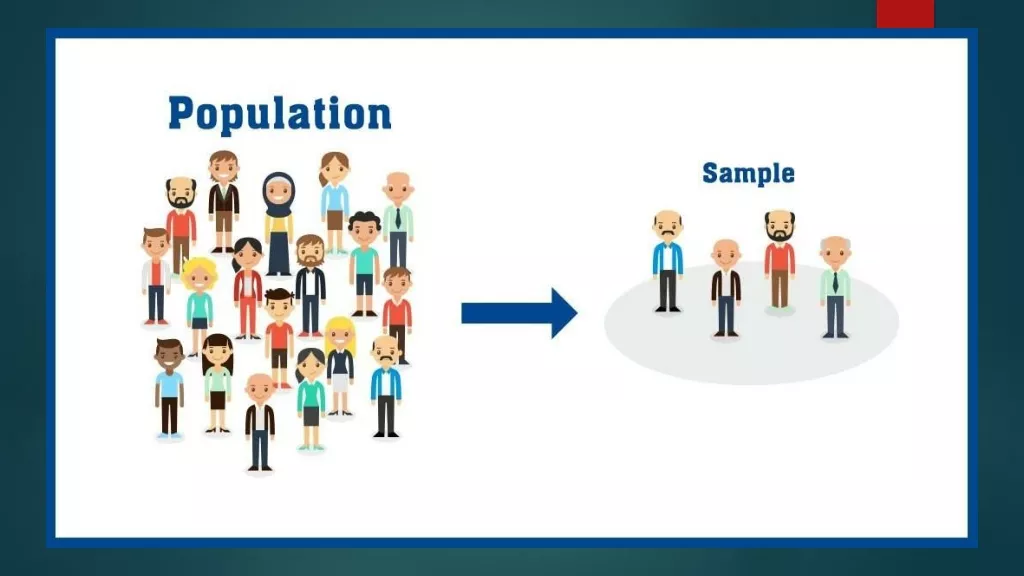
Sampling: A Mystery Sample representative portion of the population Why? Time efficiency Budget effectiveness Reduce non-sampling errors Ability to conduct further research of same population
Sampling & Non-Sampling Errors Non-sampling errors Unclear questionnaire wording or skip patterns Poor interviewing Respondent fatigue Language problems High level of non-response Omission of eligible respondents from the sample frame Inaccurate coding or data entry Sampling not representative of population
Sampling & Non-Sampling Errors Sampling (Random) errors Studying only portion of population Mathematically estimated for probability sampling procedures Cover under sample size estimations
Population & Sample Frames Four Stage Process 1. Define the Population 2. Identify Sample Frame 3. 4. Calculate Sample Size Apply Sampling Procedure Identify Sampling Frame creative part: the ideal vs a compromise e.g. customer email list, registration list, association list, even a LinkedIn Group + others Sometimes need to cross reference lists e.g. farmers, commodity association (e.g. seafood producers, dairy association) Target population may differ from study population Limitations defined Define Population sampling element sampling unit extent time e.g. Growing Links Element food service mgrs Unit Broad public sector (education, health etc) Extent Lunenburg County, NS Time 2020
Sample Size Sample Size Calculation Suppose you want to calculate the sample size for a project. Population size is not important beyond 1000 Suppose the researcher feels that the answer to the question about use of the Internet was 50% (p) in favour And was willing to accept a confidence interval of +/-5 percentage points ((E) with a 95% (Z) confidence level Based on the calculation the sample size (n) needed is ~390 n=Z pq E n=(1.96) (.5)(.5) .05 n=(3.84)(.25) .0025 n=.96/ .0025 n=384 =sample size Z=confidence level (95%) p=worst case scenario of what % of pop will respond to a dichotomous question Q=1-p E= acceptable confidence intervalor margin of error BUT you can work backwards give your sample size and response to a question and the confidence level to calculate confidence interval
Sample Size Adjustment for Small Populations If sample is 10% or higher of the population then apply finite population correction n =n/[1+(n/N)] n=original sample size N=population So for the example that the population is only 2300 Final finite sample size would be 325 with a margin of error of +/- 5 percentage points, 19 times out of 20 (confidence level)
Non-probability Sampling Procedures (don t know population size) Accidental/convenience Intercept at convenience of respondent used extensively & least representative (self selection issue) least costs & fast Purposeful/judgemental select based on another person s advice moderate to low use more research expertise Quota believe subgroup representation needed sample, screen for criteria, sample until quota is met extensively used
Probability Sampling Procedures Simple random random number table equal chance of selection Systematic every nth one with a random start avoid monotonic trend Clustered consider how people gather (e.g. meetings, forums, groups, buses) select the whole group/cluster no respondent names required
Probability Sampling Procedures Stratified subgroup representation calculate % of total pop proportion sample to represent population disproportionate: over & under sample weight data (e.g. post graduate students, part time students, regions of Canada) Multi-stage sampling combinations (e.g. stratified, systematic) list in order of execution
Weighting Data Known bias in sample if not representing population: gender geography members vs non-members low vs high users program of students branch offices Weighting compensates Beware need to know variable and bias consider if sample biased by the more engaged sample & then weighting may exaggerate the known and not represent the unknown
Example: Regional Representation by Geography Awareness study of regional lifestyle magazine Telephone interview based on a rented sample Concerned about representation by geography Sample needed Townships 2019 Pop % of pop % of sample Weight Index 5455 138 6.9 9.0 .8 One 7689 195 9.7 11.0 .9 Two 5436 138 6.9 6.1 1.1 Three 8426 213 10.7 10.5 1.0 Four 8044 204 10.2 10.4 1.0 Five 9809 248 12.4 11.5 1.1 Six 10448 265 13.2 12.5 1.1 Seven 8993 228 11.4 11.9 1.0 Eight 6161 156 7.8 7.3 1.1 Nine 8504 215 10.8 9.8 1.1 Ten 78965 2000 Region
Your Turn Next! Practice Questions
Whats Up Next? Question naire Design Analytics & Insights Quant Methods Project Proposal & Critique Research Manage ment Research Designs Exam Ethics & Standards Qual Methods Sampling