Sampling Distribution of Means and Standard Error
Learn about the concept of sampling distribution of means and standard error, how to obtain it through repeated sampling, and the theoretical nature of sampling distributions. Dive into activities to visualize and understand sampling distributions using simulations.

Download Presentation

Please find below an Image/Link to download the presentation.
The content on the website is provided AS IS for your information and personal use only. It may not be sold, licensed, or shared on other websites without obtaining consent from the author.If you encounter any issues during the download, it is possible that the publisher has removed the file from their server.
You are allowed to download the files provided on this website for personal or commercial use, subject to the condition that they are used lawfully. All files are the property of their respective owners.
The content on the website is provided AS IS for your information and personal use only. It may not be sold, licensed, or shared on other websites without obtaining consent from the author.
E N D
Presentation Transcript
Sampling distribution of the means and standard error Chong Ho Yu, Ph.D.
Review: Probability One of many views: target events / all events 10,000 applicants and 100 were accepted: p = 100/10000 = 1% or .1 Assumption: The same event can repeat over and over in the long run. What is long run? How long is long? Infinite! (In theory only)
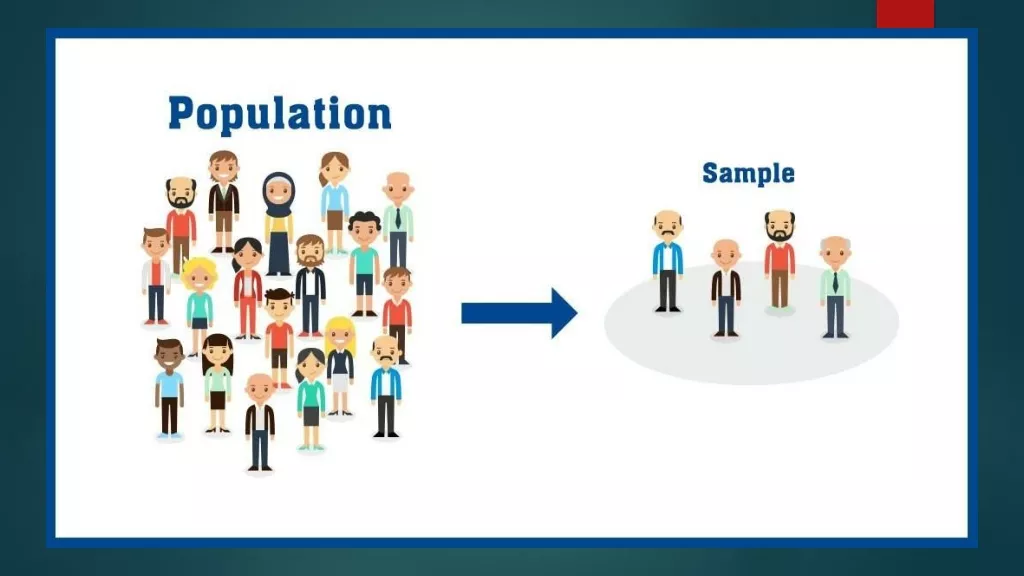
Sample of samples The sampling distribution of the mean We draw a sample from the population. Obtain the statistics (e.g. mean) and then put the sample back. Do it again and again, then we have the sampling distribution of the sample means. In theory we can repeat the process forever. The two tails of the sample distribution curve should never touch down.
Sampling distributions Sampling distribution is theoretical, NOT empirical, though we use simulations to illustrate the concept. Sampling distribution can be about any test statistics. It is no necessarily about the mean only. But it is common to use the mean for illustration.
Class activity Go to http://onlinestatbook.co m/stat_sim/sampling_di st/index.html Click begin Choose Mean and N = 25 for the middle panel. Choose Median and N = 25 for the bottom panel.
Class activity Click animated. Click animated again. What do you see? Can you explain what is going on? Caution: Sample size and the number of samples are different. In this example you have 2 sample and each sample size is 25.
Class activity You can manually add more means and medians into the graphs. To speed up the process you can click 5, which means select 5 samples and each consists of 25 subjects. Now what do you see?
Class activity Probably 5 samples are not enough to make a normal distribution. Now choose 10,000 sample. What do you see? Next, choose 100,000 Check Fit normal What do you see?
Class activity Press Clear lower 3 Choose a uniform population Repeat the same process by clicking on 10,000 samples. Check Fit Normal. Now what do you see?
Class activity Press Clear lower 3 Choose a skewed population Repeat the same process by clicking on 10,000 samples. Check Fit Normal. Now what do you see?
Class activity Press Clear lower 3 You can use your cursor to paint a customized population. Click on 10,000 samples. Check Fit Normal Now what do you see?
Class activity Go back to the skewed population. Now reduce the sample size from 25 to 10 Click 10,000 samples. Check Fit normal What do you see?
Class activity Next, reduce the sample size to 5 Click on 10,000 samples. What do you see? Reduce the sample size to 5 and click on 10,000 sample. Check Fit normal. What do you see?
Class activity Change the statistics of the lower 2 panels from mean and median to SD and variance. Change the sample size to 25 Click on 100,000 samples. Check Fit Normal. What do you see?
Central Limit Theorem (CLT) and sampling distributions No matter how messy or noisy the population is, the end result is always a normal sampling distribution! Common myth 1: Sampling distribution is about the mean. Fact: A sampling distribution can be constructed by any test statistics (e.g. median, SD, variance), not just the mean. Common myth 2: You need at least 30 subjects to create a normal sampling distribution. Fact: You can use much fewer subjects!
The bridge The sampling distribution is the bridge between the sample and the population, or between the descriptive statistics and the inferential statistics. CLT states that a sampling distribution becomes closer to normality as the sample size increases, regardless of the shape of distribution. CLT is central to large sample statistical inference and is true by limitation--it is true given that the sampling distribution is infinite.
Common myth 3 Many people don t know that hypothesis testing is based upon infinite sampling distributions, NOT the population distribution. Sample size determination is mistakenly viewed as being based upon the ratio between the sample and the population.
Faith integration Can you see divine providence in Central Limit Theorem?
Nassim Taleb In the book Fooled by randomness Taleb asserted that many phenomena in the world happen randomly. But we impose structure on it.
Leonard Mlodinow Prominent physicist His parents were both Holocaust survivors. His father was a leader in the Jewish resistance under Nazi rule in Poland. When Nazi troops took over her mother s home town, they randomly executed Jews. Her mother survived. Did it happen at random or due to a divine purpose? If God saved his mother, what would we say to those who were massacred?
Jesses Bering The Belief Instinct: The Psychology of Souls, Destiny, and the Meaning of Life A thief was eaten by a crocodile when he attempted to escape by jumping into a pool. A criminal who was just released from the prison hit the jackpot in a casino. Good things happen to both good and bad people Bad things happen to both good and bad people All things are random, but humans tend to find a pattern or a purpose in random events
Is the sequence random? 100111100110111001101 100111100110111001101100111100110111 001101100111100110111001101
Short run vs. long run Argentine-American mathematician and computer scientist Gregory John Chaitin: any attempt to decide the randomness of a sufficiently long binary string is inherently doomed to fail.
Short run vs. long run The goal of statistics is to examine whether something happens at random (by chance alone) or has a systematic pattern But it is unable to detect randomness or patterns in the short run
Short run vs. long run Something appears to be random and purposeless to us because we, as finite human beings, can only observe the data in a short run. A pattern can emerges in the long run. Central limit theorem tells us that there is a hidden cosmic order!
Should sample distribution resemble population distribution? Questionable statements concerning the CLT and normal distribution could be found in statistics texts. For example, a statistical guide for medical researchers stated, "sample values should be compatible with the population (which they represent) having a normal distribution." (Airman & Bland, 1995, p.298).
Should sample distribution resemble population distribution? Because the shape of the population distribution is unknown and could be non- normal, in statistical tests data normality resembles the sampling distribution, not the population. In other words, a test statistic from the sample will be compared against the sampling distribution. Bigger sample lower standard error.
Standard error Why is it called standard error ? Bias in estimation (off the target). The sample statistics is the estimator of the population parameter (ideally, unbiased). The standard error of the statistics is the standard deviation of those sample statistics over all possible samples drawn from the population (like repeated sampling in sampling distributions).
Standard error The SE of small samples tend to systematically underestimate the population. The question is not whether the estimation is totally bias- free. Rather, it is about how much bias? Standard error tells us how much bias.
What would James Bond do to save his girl friend?
What would James Bond do to save his girlfriend? In the movie Skyfall, the bad guy put a glass of wine on top of his girlfriend s head, and forced James Bond to shoot the glass off her head.
What would James Bond do to save his girlfriend? Mr. Bond could shoot as many times as possible and hopefully one of the bullets could hit the target (high variance approach), but one of the bullets might kill the girl, too. Alternatively, he could focus and make one best shot only (unbiased approach), but he might miss the target. If you were 007, what would you do?
Possible scenarios Which one is the ideal? We don t know the population mean and variance, and thus we estimate the standard error. As sample size increases, SE approaches 0. The mean of the sampling distribution of the means approaches the population mean, and we can get an unbiased estimate of the population.
Take home message: Take n into account We must take the sample size into account for a better estimate. S=sample SD N= sample size
Assignment 10 Read the question on Canvas Although this is a group discussion, you need to submit your own essay.


 and")