Sampling Cruise in the Clark Estuary
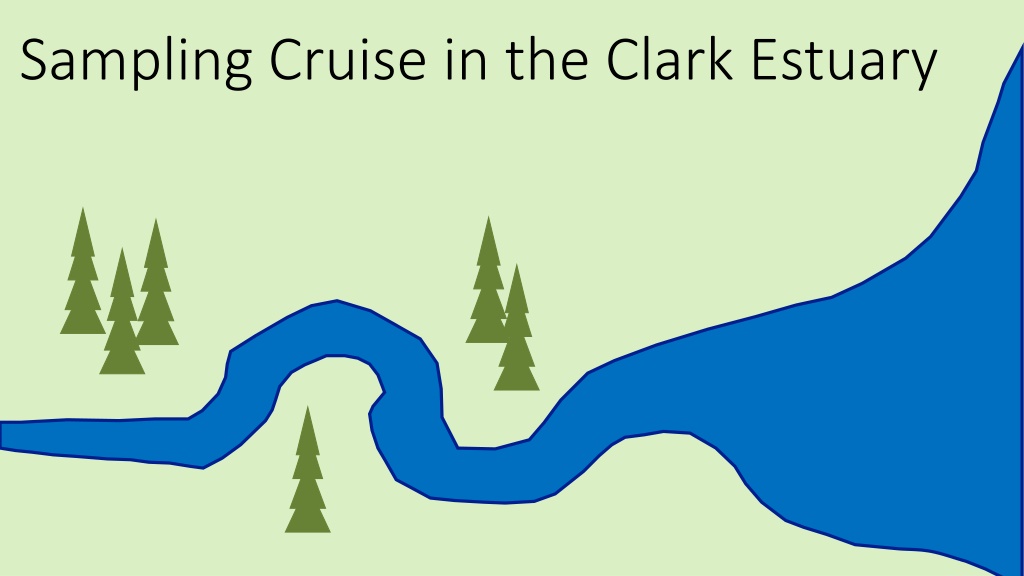

Sampling Cruise in the Clark Estuary


At each sample site, there will be three beakers to collect data from. Each water sample will be 1L.
•
For suspended sediment concentrations, you will match the color of the water in the beaker to the
color bar on the left. This will tell you how much sediment is in the water.
For example, this water sample
has 20 mg/L of suspended
sediment.
At each sample site, there will be three beakers to collect data from. Each water sample will be 1L.
•
For nutrient concentration, you will count the number of nutrient icons in each beaker. Each icon
represents 0.05 mg of nutrients. Find the nutrient concentration in mg/L.
= 0.05 mg/L
= 0.1 mg/L
= 0.15 mg/L
For example, this water sample’s
nutrient concentration is 0.3 mg/L.
0.05 mg/L * 6 = 0.3 mg/L
* 6 = 0.3 mg/L
At each sample site, there will be three beakers to collect data from. Each water sample will be 1L.
•
For phytoplankton concentration, you will count the number of phytoplankton icons in each
beaker. Each icon (no matter the shape) represents 100,000 phytoplankton cells. Find the cell
concentration in cells/L
= 100,000 cells/L
= 200,000 cells/L
= 300,000 cells/L
For example, this water sample has
700,000 cells/L of phytoplankton.
100,000 cells/L * 7 = 700,000 cells/L
* 7 = 700,000 cells/L
There are 8 sampling stations located along the estuary. By starting at the head of the
estuary, click on each station and collect suspended sediment concentrations, nutrient
concentrations, and phytoplankton concentrations at each station.
Record all data in Table 1. on your worksheet.
Site 1
Site 2
Site 3
Site 4
Site 5
Site 6
Site 7
Site 8
Site 1
= 0.05 mg/L
= 100,000 cells/L
Click to go back to site map
Suspended Sediment Concentration
Nutrient Concentration
Phytoplankton Concentration
Salinity = 0.5 PPT
Site 2
= 0.05 mg/L
Suspended Sediment Concentration
Nutrient Concentration
Phytoplankton Concentration
= 100,000 cells/L
Click to go back to site map
Salinity = 2 PPT
Site 3
= 0.05 mg/L
= 100,000 cells/L
Suspended Sediment Concentration
Nutrient Concentration
Phytoplankton Concentration
Click to go back to site map
Salinity = 5 PPT
Site 4
= 0.05 mg/L
= 100,000 cells/L
Suspended Sediment Concentration
Nutrient Concentration
Phytoplankton Concentration
Click to go back to site map
Salinity = 9 PPT
Site 5
= 0.05 mg/L
= 100,000 cells/L
Suspended Sediment Concentration
Nutrient Concentration
Phytoplankton Concentration
Click to go back to site map
Salinity = 12 PPT
Site 6
= 0.05 mg/L
= 100,000 cells/L
Suspended Sediment Concentration
Nutrient Concentration
Phytoplankton Concentration
Click to go back to site map
Salinity = 18 PPT
Site 7
= 0.05 mg/L
= 100,000 cells/L
Suspended Sediment Concentration
Nutrient Concentration
Phytoplankton Concentration
Click to go back to site map
Salinity = 20 PPT
Site 8
= 0.05 mg/L
= 100,000 cells/L
Suspended Sediment Concentration
Nutrient Concentration
Phytoplankton Concentration
Click to go back to site map
Salinity = 26 PPT
"Embark on a sampling cruise in the Clark Estuary to collect data on suspended sediment concentrations, nutrient concentrations, and phytoplankton concentrations at different sampling stations. Explore the unique ecosystem of the estuary and record valuable information to understand its health and dynamics."

Download Presentation

Please find below an Image/Link to download the presentation.
The content on the website is provided AS IS for your information and personal use only. It may not be sold, licensed, or shared on other websites without obtaining consent from the author.If you encounter any issues during the download, it is possible that the publisher has removed the file from their server.
You are allowed to download the files provided on this website for personal or commercial use, subject to the condition that they are used lawfully. All files are the property of their respective owners.
The content on the website is provided AS IS for your information and personal use only. It may not be sold, licensed, or shared on other websites without obtaining consent from the author.
E N D
Presentation Transcript
At each sample site, there will be three beakers to collect data from. Each water sample will be 1L. For suspended sediment concentrations, you will match the color of the water in the beaker to the color bar on the left. This will tell you how much sediment is in the water. 10 mg/L 15 mg/L For example, this water sample has 20 mg/L of suspended sediment. 20 mg/L 25 mg/L 30 mg/L 35 mg/L 40 mg/L 45 mg/L
At each sample site, there will be three beakers to collect data from. Each water sample will be 1L. For nutrient concentration, you will count the number of nutrient icons in each beaker. Each icon represents 0.05 mg of nutrients. Find the nutrient concentration in mg/L. = 0.05 mg/L 0.05 mg/L * 6 = 0.3 mg/L = 0.1 mg/L * 6 = 0.3 mg/L For example, this water sample s nutrient concentration is 0.3 mg/L. = 0.15 mg/L
At each sample site, there will be three beakers to collect data from. Each water sample will be 1L. For phytoplankton concentration, you will count the number of phytoplankton icons in each beaker. Each icon (no matter the shape) represents 100,000 phytoplankton cells. Find the cell concentration in cells/L = 100,000 cells/L 100,000 cells/L * 7 = 700,000 cells/L = 200,000 cells/L * 7 = 700,000 cells/L = 300,000 cells/L For example, this water sample has 700,000 cells/L of phytoplankton.
There are 8 sampling stations located along the estuary. By starting at the head of the estuary, click on each station and collect suspended sediment concentrations, nutrient concentrations, and phytoplankton concentrations at each station. Record all data in Table 1. on your worksheet. Site 8 Site 8 Site 3 Site 3 Site 7 Site 4 Site 7 Site 4 Site 6 Site 6 Site 2 Site 2 Site 1 Site 1 Site 5 Site 5
Site 1 Click to go back to site map Salinity = 0.5 PPT Click to go back to site map Phytoplankton Concentration Suspended Sediment Concentration Nutrient Concentration 10 mg/L 15 mg/L 20 mg/L 25 mg/L 30 mg/L 35 mg/L 40 mg/L 45 mg/L = 0.05 mg/L = 100,000 cells/L
Site 2 Click to go back to site map Salinity = 2 PPT Click to go back to site map Phytoplankton Concentration Suspended Sediment Concentration Nutrient Concentration 10 mg/L 15 mg/L 20 mg/L 25 mg/L 30 mg/L 35 mg/L 40 mg/L 45 mg/L = 0.05 mg/L = 100,000 cells/L
Site 3 Click to go back to site map Salinity = 5 PPT Click to go back to site map Phytoplankton Concentration Suspended Sediment Concentration Nutrient Concentration 10 mg/L 15 mg/L 20 mg/L 25 mg/L 30 mg/L 35 mg/L 40 mg/L 45 mg/L = 0.05 mg/L = 100,000 cells/L
Site 4 Click to go back to site map Salinity = 9 PPT Click to go back to site map Phytoplankton Concentration Suspended Sediment Concentration Nutrient Concentration 10 mg/L 15 mg/L 20 mg/L 25 mg/L 30 mg/L 35 mg/L 40 mg/L 45 mg/L = 0.05 mg/L = 100,000 cells/L
Site 5 Click to go back to site map Salinity = 12 PPT Click to go back to site map Phytoplankton Concentration Suspended Sediment Concentration Nutrient Concentration 10 mg/L 15 mg/L 20 mg/L 25 mg/L 30 mg/L 35 mg/L 40 mg/L 45 mg/L = 0.05 mg/L = 100,000 cells/L
Site 6 Click to go back to site map Salinity = 18 PPT Click to go back to site map Phytoplankton Concentration Suspended Sediment Concentration Nutrient Concentration 10 mg/L 15 mg/L 20 mg/L 25 mg/L 30 mg/L 35 mg/L 40 mg/L 45 mg/L = 0.05 mg/L = 100,000 cells/L
Site 7 Click to go back to site map Salinity = 20 PPT Click to go back to site map Phytoplankton Concentration Suspended Sediment Concentration Nutrient Concentration 10 mg/L 15 mg/L 20 mg/L 25 mg/L 30 mg/L 35 mg/L 40 mg/L 45 mg/L = 0.05 mg/L = 100,000 cells/L
Site 8 Click to go back to site map Salinity = 26 PPT Click to go back to site map Phytoplankton Concentration Suspended Sediment Concentration Nutrient Concentration 10 mg/L 15 mg/L 20 mg/L 25 mg/L 30 mg/L 35 mg/L 40 mg/L 45 mg/L = 0.05 mg/L = 100,000 cells/L