Root Cause of Sustained Volume Pressure
The report covers data for the four weeks ending April 23, 2023, highlighting a data problem in the Circana/IRI system affecting Walmart sales tracking. The investigation uncovered coding errors for Walmart private brand SKUs, leading to undercounting of sales. Corrections are underway, impacting reported trends. The methodology, which includes comparisons to previous years, reflects trends in fresh mushrooms dollar sales for 2020-2023. Stay informed about the data update and its implications on reported data.
Download Presentation

Please find below an Image/Link to download the presentation.
The content on the website is provided AS IS for your information and personal use only. It may not be sold, licensed, or shared on other websites without obtaining consent from the author.If you encounter any issues during the download, it is possible that the publisher has removed the file from their server.
You are allowed to download the files provided on this website for personal or commercial use, subject to the condition that they are used lawfully. All files are the property of their respective owners.
The content on the website is provided AS IS for your information and personal use only. It may not be sold, licensed, or shared on other websites without obtaining consent from the author.
E N D
Presentation Transcript
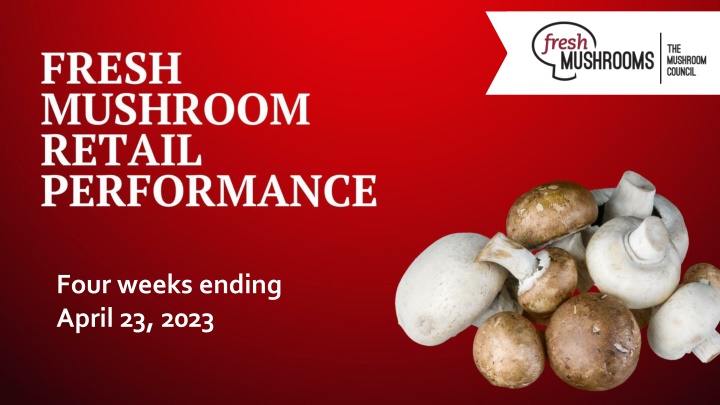
Four weeks ending April 23, 2023
Please note In the process of understanding the root cause of the sustained volume pressure, Anne-Marie Roerink, our retail channel consultant, discovered a substantial data problem in the Circana/IRI system. Upon noticing that the Walmart loss of households and trips more than tripled that of grocery stores, she launched an investigation into whether these numbers could be correct. Based on her other category work in meat, candy, deli and other areas of the store, Walmart has been an above-average performer in the past two years virtually all categories, which red-flagged the mushroom finding. Knowing that Walmart had required all grower/shippers to switch to private brands focused the investigation on those 10 Walmart private brand SKUs. Walmart does not allow SKU level access to their private brand items, but collaborated with us and IRI to dig into the issue. It turns out that the two biggest Walmart SKUs have not been captured as they are coded incorrectly as cereal. With grower/shippers having started to change branded SKUs to Walmart brand SKUs in the fall of 2022 into February of 2023, this means a large amount of volume/dollars has not been captured in the past nine months, in particular. Given Walmart s size, this improves the national averages by some 7 percentage points and likely more in Walmart-centric Midwest markets. Here is an estimate for how Total US reported trends would adjust (based on last 13 weeks): Model iFresh (US MULO) iFresh (US MULO-estimate with fix) Dollar sales $308,136,988 $330,136,988 Dollar sales YA $332,461,501 $332,461,501 % Change vs YA -7.3% -0.7% The SKU recode is in process but will not hit the data platform until 5/29. Rather than holding up the quad week data distribution, please be aware of the undercounting of Walmart sales in the 4/23/23 report and all reports going back. The minute the updated information is available, Anne-Marie will re-pull all data endings going back 52 weeks to ensure everyone can correct internal spreadsheets. 2
Methodology The report covers the four weeks ending 23 April, 2023 with week endings: April 2, 2023 April 9, 2023 April 16, 2023 April 23, 2023 Comparisons to year ago (YA) refer to 2022; comparisons to two years ago (2YA) refer to 2021 and 3YA to 2020 Dollar references are the retail value, volume is reflected in pounds Data is based on the Circana total multi-outlet universe, which includes supermarkets, supercenters, club, commissaries, etc. It excludes specialty stores (Whole Foods, Sprouts, etc.) Package size is the last tab left that is derived from SKU analysis. This means Walmart private brand, H-E-B, Hy-Vee and others are not included, which causes the gap between total market and SKU-level data Source: Circana, Integrated Fresh, MULO, 4 weeks ending 4/23/2023 3
Four-year dollar sales trend In the 4-week view, March 2023 sales are below that of the past four years Fresh mushrooms dollar sales four w.e. 4/23/2023 Fresh mushrooms dollar sales latest 52 w.e. 4/23/2023 $1,404,362,944 $1,292,743,478 $117,377,475 $1,230,769,469 $1,213,026,599 $104,130,956 $99,608,248 $91,838,120 2020 2021 2022 2023 2020 2021 2022 2023 Source: Circana, Integrated Fresh, MULO, 4 weeks and year-to-date ending 4/23/2023 versus same periods the past four years 4
Four-year unit sales trend Unit sales were below 2020 levels in the quad week and year-to-date views Fresh mushrooms unit sales four w.e. 4/23/2023 Fresh mushrooms unit sales latest 52 w.e. 4/23/2023 522,802,636 44,208,830 471,363,726 466,765,829 38,611,032 409,464,949 34,944,269 30,226,412 2020 2021 2022 2023 2020 2021 2022 2023 Source: Circana, Integrated Fresh, MULO, 4 weeks and year-to-date ending 4/23/2023 versus same periods the past four years 5
Four-year volume (pound) sales trend In the YTD and the quad-week view, pounds dipped below pre-pandemic levels Fresh mushrooms volume sales latest 52 w.e. 4/23/2023 Fresh mushrooms volume sales four w.e. 4/23/2023 27,713,101 330,229,841 24,551,552 294,412,876 290,980,191 21,935,600 261,019,486 19,600,624 2020 2021 2022 2023 2020 2021 2022 2023 Source: Circana, Integrated Fresh, MULO, 4 weeks and year-to-date ending 4/23/2023 versus same periods the past four years 6
Mushroom contribution to the department and category The mushroom share of total produce and vegetables is below prior year levels 4 w.e. 4/23/2023 Mushroom $ share Share of total produce Share of total vegetables L-52 w.e. 4/23/2023 Mushroom $ share Share of total produce Share of total vegetables 2020 2.1% 3.9% 2020 1.9% 3.7% 2021 1.9% 3.8% 2021 2.0% 3.9% 2022 1.7% 3.5% 2022 1.8% 3.6% 2023 1.6% 3.2% 2023 1.6% 3.3% Source: Circana, Integrated Fresh, MULO, 4 weeks and year-to-date ending 4/23/2023 7
Mushrooms price per unit Price increases for mushrooms were above those of total produce and total vegetables. This was driven by white button mushrooms (slide 10) 4 w.e. 4/23/2023 Average price/unit Total produce Total vegetables Mushrooms 2020 $2.29 $2.06 $2.66 2021 $2.37 $2.08 $2.70 2022 $2.60 $2.26 $2.85 2023 $2.60 | +0.2% $2.32 | +2.6% $3.04 | +6.6% Source: Circana, Integrated Fresh, MULO, YTD weeks ending 4/23/2023 8
Mushroom price per volume (pound) On a pound basis, mushroom inflation was also ahead of vegetables. Other vegetables apply shrinkflation measures to offset volume inflation 4 w.e. 4/23/2023 Average price/pound Total produce Total vegetables Mushrooms 2020 $1.59 $1.70 $4.24 2021 $1.72 $1.84 $4.24 2022 $1.89 $1.96 $4.54 2023 $1.89 | -0.1% $2.00 | +2.1% $4.69 | +3.2% Source: Circana, Integrated Fresh, MULO, YTD weeks ending 4/23/2023 9
Price per volume by quarter/month The rate of inflation on a per pound basis accelerated after coming down in Q3 and Q4 Mushrooms price per pound and change vs. YA (fixed and random weight) $5.00 10.0% 8.9% 9.0% $4.75 $4.77 $4.80 $4.69 $4.56 $4.68 8.0% 7.0% 7.6% $4.60 $4.48 7.0% 6.0% $4.40 6.4% $4.40 $4.32 5.0% $4.27 $4.27 $4.25 $4.23 4.9% $4.19$4.25 4.0% $4.13 $4.20 3.0% 3.5% 3.1% 3.2% 2.0% 2.5% $4.00 2.3% 2.3% 2.1% 1.9% 1.0% 1.8% 0.4% Q2 21 $3.80 0.0% Q3 21 Q3 22 Q3 20 2019 Q1 21 Q1 22 Q1 23 Q4 20 Q4 21 Q4 22 Q1 20 4 we 4/23/23 Q2 22 Q2 20 Source: Circana, Integrated Fresh, MULO, 2019-w.e. 4/23/2023 10
Price per volume and unit by type 4 w.e.4/23/2023 Price per pound % change vs. 22 % change vs. 21 Total mushrooms $4.69 +3.2% +10.5% White mushrooms $4.05 +1.6% +8.6% Brown mushrooms $5.12 +2.4% +10.8% Specialty mushrooms $13.87 +3.5% +12.6% 4 w.e. 4/23/2023 Price per unit % change vs. 22 % change vs. 21 Total mushrooms $3.04 +6.6% +12.7% White mushrooms $2.76 +6.7% +12.6% Brown mushrooms $3.24 +4.6% +10.9% Specialty mushrooms $4.68 +3.2% +12.7% Brown mushrooms include crimini and portabella Specialty mushrooms include shiitake, oyster, enoki, chanterelle, morel, wood ear, porcini, black forest and other Source: Circana, Integrated Fresh, MULO, 4 w.e. 4/23/2023 11
Mushroom dollar, unit, volume sales Double-digit pressure for a number of years 4 w.e. 4/23/2023 dollars $91.8M -7.8% -13.5% -10.6% Dollar Unit Volume growth vs. YA growth vs. YA growth vs. YA volume (lbs) 19.6M -11.8% vs. 21 -21.8% vs. 20 -20.2% vs. 21 -29.3% vs. 20 -21.7% vs. 21 -31.6% vs. 20 Source: Circana, Integrated Fresh, MULO, 4 weeks ending 4/23/2023 12
Vegetables and mushroom dollar sales vs. YA and 3YA Now going up against the March 2020 spikes, sales drop behind the 3YA levels Dollar sales versus year ago and three years ago Fresh vegetables vs YA Fresh vegetables vs. 3YA Fresh mushrooms vs. YA Fresh mushrooms vs. 3YA 22.6% 20.0% 17.4% 15.6% 13.4% 13.4% 13.6% 10.1% 8.8% 15.1% 10.6% 8.7% 6.5% 3.5 4.9% 3.1% 3.9% 1.2% 0.1% 5.0% -1.4% 0.6% -4.3% 2019 2020 2021 Q1 '22 Q2 '22 Q3 '22 Q4 '22 Q1 '23 4 we 4/23/23 -2.8% -3.9% -5.8% -4.4% -5.5% -5.8% -7.8% -7.9% -21.8% Source: Circana, Integrated Fresh, MULO, 2019-w.e. 4/23/2023 13
Vegetables and mushroom pound sales vs. YA and 2019 Vs. 3YA levels shows just how high the pandemic spikes were Volume (pound) sales versus year ago and three years ago Fresh vegetables vs YA Fresh vegetables vs. 3YA Fresh mushrooms vs. YA Fresh mushrooms vs. 3YA 17.0% 13.4% 8.5% 5.9% 15.1% 3.9% 3.1% -0.7% 1.8% 1.0% 0.4% -1.6% -1.4% -0.8% -1.4% -2.9% Q1 '23 -3.8% Q3 '22 2019 2020 2021 Q1 '22 Q2 '22 Q4 '22 4 we 4/23/23 -8.0% -4.4% -4.2% -5.4% -6.9% -7.3% -10.6% -10.8% -10.2% -10.2% -11.1% -13.4% -17.1% -18.9% -29.3% Source: Circana, Integrated Fresh, MULO, 2019-w.e. 4/23/2023 14
Share of dollars sold on merchandising While still low, at 19%, more pounds were sold on promotion, but it did not boost dollar growth equally in the quad-week Fresh mushrooms 4 w.e. Vs. Latest 52 w.e. 4/23/2023 Vs. 4/23/2023 2022 2022 Share of dollars sold on promotion 19.2% +23.9% 16.6% +12.0% * Any merchandising, including feature, display, feature & display and temporary price reductions Source: Circana, Integrated Fresh, MULO, YTD through weeks ending 4/23/2023 15
Base and incremental sales Volume incrementality increased slightly in the latest 4 weeks Volume sales w.e. 4/23/2023 Dollar sales w.e. 4/23/2023 Base Incremental Base Incremental $1,400,000,000 300,000,000 6.6% incremental 3.3% incremental $1,200,000,000 250,000,000 $1,000,000,000 200,000,000 $800,000,000 150,000,000 $600,000,000 100,000,000 $400,000,000 7.9% incremental 3.8% incremental 50,000,000 $200,000,000 0 $0 L-52 we 4/23/23 4 we 4/23/23 L-52 we 4/23/23 4 we 4/23/23 Source: Circana, Integrated Fresh, MULO, 4 weeks ending 4/23/2023 16
Over indexing versus under indexing regions The Northeast had a strong April performance Use as comparison to understand importance/size of mushrooms L-52 w.e. 4/23/2023 Share of veg. $ Share of mushrooms $ $ sales WEST PLAINS growth vs. YA GREAT LAKES Total US California Great Lakes Mid-South Northeast Plains South Central Southeast West 100.0% 11.5% 13.2% 13.2% 18.0% 6.6% 9.1% 15.6% 12.8% 100.0% 12.8% 15.1% 11.7% 18.3% 6.3% 7.0% 13.2% 15.7% -4.8% -4.7% -4.8% -5.9% -2.7% -4.3% -3.9% -7.0% -4.7% NORTHEAST MID SOUTH CALIFORNIA SOUTHEAST SOUTH CENTRAL = Above-average share = Above-average performance Source: Circana, Integrated Fresh, MULO, YTD through 4/23/2023 | Total fresh vegetables and total fresh mushrooms 17
Performance summary whites, browns and exotics Brown (combination of crimini and ports) continues to pull away from whites Dollar share $ sales vs. 2022 $ sales vs. 2020 Volume (lbs) Lbs Lbs Lbs vs. 2020 4 weeks ending 4/23/2023 Dollars share vs. 2022 $91.8M 100.0% -7.8% -21.8% 19.6M 100.0% -10.6% -29.3% Total fresh mushrooms $45.6M 53.4% -14.2% -31.9% 11.3M 60.8% -15.6% -36.4% White mushrooms $40.6M 41.1% -0.6% -8.7% 7.9M 37.3% -2.9% -16.9% Brown mushrooms $5.6M 5.6% +1.0% -4.9% 0.4M 1.9% -2.3% -13.0% Specialty mushrooms Source: Circana, Integrated Fresh, MULO, 4 weeks ending 4/23/2023 18
White button mushrooms dollar performance Dollars L-52 w.e. 4/23/2023 $626.1M White button mushroom, $ and % vs YA (fixed and random weight) 15.0% $250,000,000 10.0% $191M $182M $200,000,000 $173M $169M $168M 5.0% $159M $158M $154M $156M 4.6% -9.2% vs. YA $150,000,000 0.0% -4.2% -4.6% -6.7% -5.0% $100,000,000 -6.3% -10.0% $45.6M -10.4% Average price/unit $2.74 $50,000,000 -10.8% -15.0% -14.2% -14.5% -16.4% -20.0% $0 Q2 22 Q2 21 Q3 22 Q3 21 4 WE 4/23/23 Q4 21 Q4 22 Q1 23 Q1 22 Q1 21 +8.4% vs. YA Source: Circana, Integrated Fresh, MULO, 2021 plus 4 weeks ending 4/23/2023 19
White button mushrooms volume performance Pounds L-52 w.e. 4/23/2023 152.2M White button mushroom, lbs and % vs YA (fixed and random weight) 15.0% 60,000,000 50.7M 3.5% 10.0% 46.7M 46.0M 45.1M 44.4M 50,000,000 5.0% 42.6M 41.6M 38.4M 37.6M 0.0% 40,000,000 -14.6% vs YA -5.0% -9.6% -10.1% -11.0% -12.0% -15.7%-12.2% 30,000,000 -10.0% -15.8% -15.6% -18.4% -15.0% 20,000,000 11.3M -20.0% Average price/pound $4.11 10,000,000 -25.0% -30.0% - Q2 21 Q2 22 Q1 22 Q1 23 Q1 21 Q4 21 Q4 22 4 WE 4/23/23 Q3 21 Q3 22 +6.3% vs. YA Source: Circana, Integrated Fresh, MULO, 2021 plus 4 weeks ending 4/23/2023 20
Crimini mushrooms dollar performance Dollars L-52 w.e. 4/23/2023 $424.2M Crimini mushroom, $ and % vs YA (fixed and random weight) 20.0% $140,000,000 15.6% $116M 15.0% $112.1M 10.8% $109.9M $120,000,000 $107.7M$99.0M $98.5M $95.8M 10.0% $95.2M 5.7% 7.1% 6.3% $100,000,000 $89.2M 5.0% +7.3% vs. YA 0.5% $80,000,000 -3.1% 0.0% -5.8% $60,000,000 -6.7% -5.0% $33.2M $40,000,000 -10.0% Average price/unit $3.22 -9.1% -15.0% $20,000,000 -20.0% $0 Q2 22 Q2 21 Q1 21 Q1 23 Q1 22 Q4 21 Q4 22 Q3 21 Q3 22 4 WE 4/23/23 +7.5% vs. YA Source: Circana, Integrated Fresh, MULO, 2021 plus 4 weeks ending 4/23/2023 21
Crimini mushrooms volume performance Pounds L-52 w.e. 4/23/2023 86.7M Crimini mushroom, lbs and % vs YA (fixed and random weight) 20.0% 30,000,000 25.3M 15.0% 23.5M 23.5M 22.8M 15.4% 22.0M 25,000,000 21.9M 20.8M 10.0% 20.1M 19.5M 3.8% 20,000,000 2.0% 5.0% -1.2% vs. YA -0.1% 0.0% -4.4% 15,000,000 -5.0% 10,000,000 6.6M -7.8% -10.0% -8.2% -8.9% -8.5% Average price/pound $4.89 -8.3% 5,000,000 -15.0% -20.0% - Q1 21 Q4 22 Q4 21 Q1 23 Q1 22 Q2 21 Q2 22 Q3 22 4 WE 4/23/23 Q3 21 +8.5% vs. YA Source: Circana, Integrated Fresh, MULO, 2021 plus 4 weeks ending 4/23/2023 22
OTHER INSIGHTS Packaged (fixed weight) versus random weight Package-size analysis Organic versus conventional Value-added versus whole/uncut 23
Packaged (fixed weight) versus random weight While both down, fixed weight did better than random weight 4 W.E. 4/23/2023 | Share of total mushroom sales and sales growth % Fixed weight Random weight Dollar growth -7.7% -9.0% Share of mushroom $ sales 95.4% 4.6% Volume growth -10.8% -6.3% Share of mushroom lbs sales 96.0% 4.0% Source: Circana, Integrated Fresh, MULO, 4 weeks ending 4/23/2023 UPC-level analysis which excludes certain items due to Circana/retailer agreements 24
Organic versus conventional mushrooms sales Organic sales outperform conventional 4 w.e. 4/23/2023 | Share of total mushroom sales and sales growth % Unit growth -15.0% Volume growth -11.7% Market size $79.0M $ growth -9.4% Conventional Unit growth -0.8% Volume growth -1.1% Market size $12.8M $ growth +3.1% Organic 10.7% of pound sales Source: Circana, Integrated Fresh, MULO, 4 weeks ending 4/23/2023 compared with year ago UPC-level analysis which excludes certain items due to Circana/retailer agreements 25
Cut/prepared versus whole mushrooms No preparation (whole) had the better performance 4 w.e. 4/23/2023 | Share of total mushroom sales and sales growth % Unit growth -9.4% Volume growth -6.8% Market size $46.3M $ growth -3.8% No preparation Unit growth -17.3% Volume growth -14.7% Market size $45.5M $ growth -11.5% Cut/prepped 46.2% of lbs sales Source: Circana, Integrated Fresh, MULO, 4 weeks ending 4/23/2023 compared with year ago UPC-level analysis which excludes certain items due to Circana/retailer agreements 26
