Risk Preparedness Methodologies Overview


1
The
Risk Preparedness
Methodolog
ies
–
O
verview
S
t
a
k
e
h
o
l
d
e
r
W
e
b
i
n
a
r
o
n
R
i
s
k
P
r
e
p
a
r
e
d
n
e
s
s
M
e
t
h
o
d
o
l
o
g
i
e
s
5
t
h
S
e
p
t
e
m
b
e
r
2
0
1
9
2
Electricity Risk Preparedness Regulation
E
N
T
S
O
-
E
t
o
p
r
o
p
o
s
e
m
e
t
h
o
d
o
l
o
g
y
f
o
r
i
d
e
n
t
i
f
y
i
n
g
c
r
i
s
i
s
s
c
e
n
a
r
i
o
s
i
n
a
r
e
g
i
o
n
a
l
c
o
n
t
e
x
t
,
o
n
t
h
e
b
a
s
i
s
o
f
t
h
e
f
o
l
l
o
w
i
n
g
r
i
s
k
s
:
•
R
a
r
e
a
n
d
e
x
t
r
e
m
e
n
a
t
u
r
a
l
h
a
z
a
r
d
s
;
•
A
c
c
i
d
e
n
t
a
l
h
a
z
a
r
d
s
g
o
i
n
g
b
e
y
o
n
d
t
h
e
N
-
1
s
e
c
u
r
i
t
y
c
r
i
t
e
r
i
o
n
,
a
n
d
e
x
c
e
p
t
i
o
n
a
l
c
o
n
t
i
n
g
e
n
c
i
e
s
;
•
C
o
n
s
e
q
u
e
n
t
i
a
l
h
a
z
a
r
d
s
i
n
c
l
u
d
i
n
g
c
o
n
s
e
q
u
e
n
c
e
s
o
f
M
a
l
i
c
i
o
u
s
a
t
t
a
c
k
s
a
n
d
o
f
f
u
e
l
s
h
o
r
t
a
g
e
s
;
E
N
T
S
O
-
E
t
o
p
r
o
p
o
s
e
m
e
t
h
o
d
o
l
o
g
y
f
o
r
a
s
s
e
s
s
i
n
g
s
h
o
r
t
-
t
e
r
m
a
d
e
q
u
a
c
y
(
s
e
a
s
o
n
a
l
t
o
d
a
y
a
h
e
a
d
)
w
h
i
c
h
s
h
a
l
l
c
o
v
e
r
:
•
U
n
c
e
r
t
a
i
n
t
y
o
f
i
n
p
u
t
s
s
u
c
h
a
s
p
r
o
b
a
b
i
l
i
t
y
o
f
t
r
a
n
s
m
i
s
s
i
o
n
o
r
g
e
n
e
r
a
t
i
o
n
u
n
p
l
a
n
n
e
d
o
u
t
a
g
e
,
s
e
v
e
r
e
w
e
a
t
h
e
r
c
o
n
d
i
t
i
o
n
s
a
n
d
v
a
r
i
a
b
i
l
i
t
y
o
f
d
e
m
a
n
d
;
•
P
r
o
b
a
b
i
l
i
t
y
o
f
c
r
i
s
i
s
s
i
t
u
a
t
i
o
n
;
•
P
r
o
b
a
b
i
l
i
t
y
o
f
s
i
m
u
l
t
a
n
e
o
u
s
c
r
i
s
i
s
s
i
t
u
a
t
i
o
n
.
Status quo
Way forward
Methodologies have been reviewed
within ENTSOE
‘Shadow Opinion’ received from
ACER and EC
Methodologies submitted for public
consultation via ENTSOE
Consultation Hub
RPR – Project Status Report
Consultation to run from 8
th
July
until 8
th
October
Collation of consultation comments
Presentation of comments back to
ECG 19
th
November 2019
Amendments to Methodology
following consultation.
Submission to ACER of final
methodologies by 5
th
January 2020
3
Next steps
Webinar today
Maintain close liaison with DG
Energy & ACER
4
Methodology to Identify
Regional Electricity Crisis
Scenarios
Methodology Overview
5
Article 13: Handing of sensitive information
Article 7:
Identification of
national electricity
crisis scenarios
Article 8:
Identification of
regional electricity
crisis scenarios
Article 9:
Evaluation of
regional electricity
crisis scenarios at
a national level
Article 10:
Ranking of crisis
scenarios by their
regional impact
Article 11:
Presentation of
most relevant
scenarios
Article 12: Review
Article 14: Publication and implementation of the methodology
Article 15: Language
ENTSO-E
TSOs
All
Key
Art. 7.
Identification of national electricity crisis scenarios
candidates
6
•
National crisis scenarios candidates must be
determined by the TSO(s) in close cooperation
with the national competent authority
•
The crisis scenarios should focus on electricity
crises only
•
historical electricity crises that may occur again
(both experienced nationally and by other TSOs)
•
available operational expertise and experience on
credible future crisis scenarios
•
interruption of cross-border supply and services
that are heavily relied upon
•
Cooperation between the Competent Authority
and TSO is crucial to identify and define
scenarios outside the scope of TSOs expertise
•
For each national scenario that will be defined,
cross-border dependencies
are
assessed
S
t
e
p
1
[
T
S
O
s
]
1.
Identification of crisis scenarios at a national level
2.
Identification of cross-border dependencies
3.
Description of a national electricity crisis scenario
4.
Submission of national electricity crisis scenario
Art. 8 Identification of regional electricity crisis scenarios
7
•
The national electricity crisis scenarios are
collated and combined by ENTSO-E
•
Individual submissions from each TSO are
quality checked in order to:
•
ensure that the required data is completed
•
identify scenarios not considered in national
submissions that should be studied
•
If national submissions are considered
deficient, ENTSO-E shall ask the relevant
TSOs to address the deficiency
•
The national crisis scenarios are collated into
respective regional scenarios
•
Gap analysis shall be performed on a
taxonomy of initiating events
•
ENTSO-E shall consider infrastructure
disruption scenarios, incl. those related to the
natural gas supply, as developed by ENTSO-G
and ESA report on nuclear fuel security of
supply.
S
t
e
p
2
[
E
N
T
S
O
-
E
]
1.
Aggregation of national scenarios
2.
Gap analysis
3.
Inclusion of scenarios related to connected infrastructure
4.
Finalisation
Art
.
9
Evaluation of regional electr
.
crisis scen
.
at a national level
8
•
Each TSO should indicate, for their
control areas, the likelihood and the
impacts on the electricity system of each
scenario identified …….consistent with
the rating scales provided (Appendix I),
in terms of Expected Energy Not
Supplied and Loss of load expectation.
S
t
e
p
3
[
T
S
O
s
]
1.
Assessment of scenario impact per
MS
2.
Identification of cross-border impacts per
MS
3.
Submission of national crisis scenario
assessments
*
’EENS%’ is calculated by dividing expected energy not served for the duration of
load curtailment by the total annual energy consumption of a Member State;
’LOLE’ (Loss of Load Expectation) is expressed in hours and represents the number
of hours in which supply would not meet demand due to the crisis scenario
Art. 9
(
continued
)
S
t
e
p
3
[
T
S
O
s
]
(
c
o
n
t
i
n
u
e
d
)
Note that EENS%, LOLE and likelihood all have
impact on the overall scenario assessment
On the impact scale, note that:
•
LOLE expresses crisis duration – but could
amplify a prolonged problem of a very low
magnitude
•
EENS% will „catch” even a short-lived crisis
impacting sufficiently large energy consumption
volume
4. Ranking of regional crisis scenarios by their regional impact. (Art 10)
10
10
•
The regional impact of each scenario is
assessed using the following method: for each
scenario, the national “overall impact rating”
and “overall rating of the strength of the cross-
border dependencies” is collected,
•
a rating of a scenario is calculated as a sum
over all Member States of “overall impact
ratings” weighted by the “overall ratings of the
strength of the cross-border dependencies”.
x
=
national scenario impact rating
strength of the cross-
border dependencies
r
e
g
i
o
n
a
l
i
m
p
a
c
t
S
t
e
p
4
[
E
N
T
S
O
-
E
]
1.
Gathering the national impact assessments
per MS
2.
Consistency Check of cross-border impacts
3.
Evaluation of regional impacts
4.
Ranking regional crisis scenarios according
to their relevance
11
11
Methodology for short term
and seasonal adequacy
assessments
Energy transition requires a robust methodology
13
13
Adequacy:
different products for specific purposes
S
c
o
p
e
o
f
t
h
i
s
M
e
t
h
o
d
o
l
o
g
y
T
h
e
n
e
a
r
e
r
t
o
r
e
a
l
t
i
m
e
,
t
h
e
h
i
g
h
e
s
t
a
c
c
u
r
a
c
y
i
s
r
e
q
u
i
r
e
d
14
14
Principle elements for adequacy
15
15
Legal document and explanatory note
Methodology for short term and seasonal adequacy is described within 2 documents
16
16
Structure of legal document
W
h
e
r
e
a
s
;
1
.
S
u
b
j
e
c
t
M
a
t
t
e
r
a
n
d
s
c
o
p
e
•
Legal Background (supported by
Legal Advisers)
•
Brief description and application
scope
2
.
D
e
f
i
n
i
t
i
o
n
s
a
n
d
i
n
t
e
r
p
r
e
t
a
t
i
o
n
•
Reference to other legal
documents with common
definitions
•
Custom Definitions
3
.
A
d
e
q
u
a
c
y
A
s
s
e
s
s
m
e
n
t
–
D
e
s
c
r
i
p
t
i
o
n
•
M
a
i
n
p
a
r
t
o
f
t
h
e
d
o
c
u
m
e
n
t
•
Generic description of Modelling
Methodology
4
.
S
e
a
s
o
n
a
l
a
d
e
q
u
a
c
y
a
s
s
e
s
s
m
e
n
t
;
5
.
S
h
o
r
t
-
t
e
r
m
a
d
e
q
u
a
c
y
a
s
s
e
s
s
m
e
n
t
s
•
Specific notes on each
assessment
•
Indicator description and
adequacy analysis approach
7
.
P
u
b
l
i
c
a
t
i
o
n
a
n
d
i
m
p
l
e
m
e
n
t
a
t
i
o
n
•
Commitment to publish after
approval of ACER
•
Commitment to implement
within 10 months after ACER’s
approval
6
.
A
d
e
q
u
a
c
y
A
s
s
e
s
s
m
e
n
t
–
P
r
o
c
e
s
s
•
Data preparation, Probabilistic
Modelling, Result Analysis,
Report Drafting, Result
Dissemination
•
Supported by “
High-level
information flow scheme” in
Appendix I & “High-level
Business process diagram” in
Appendix II
17
17
Visualisation
examples
S
e
a
s
o
n
a
l
A
d
e
q
u
a
c
y
A
s
s
e
s
s
m
e
n
t
S
h
o
r
t
-
t
e
r
m
A
d
e
q
u
a
c
y
A
s
s
e
s
s
m
e
n
t
Break of 5 minutes
Time for questions/answers
Risk preparedness strengthen further European
cooperation through strong common methodologies
Give your views on:
the “Methodology for identification of Electricity Crisis
Scenarios at a regional level” and the “Methodology for
short term and seasonal adequacy assessment”
https://consultations.entsoe.eu/
Public consultation on going until 8 October
Takeaways
21
21
T
h
a
n
k
y
o
u
f
o
r
y
o
u
r
a
t
t
e
n
t
i
o
n
Please send any questions to:
Bruce.Riddington@sec.entsoe.eu or Alban.Joyeau@entsoe.eu
In a webinar conducted on 5th September 2019, ENTSO-E proposed methodologies for electricity risk preparedness regulation, crisis scenario identification, short-term adequacy assessment, and more. The project status report outlines the ongoing review process, public consultation, and upcoming steps. Key methodologies for identifying, evaluating, and ranking electricity crisis scenarios were detailed, emphasizing the importance of handling sensitive information, publication, and implementation of the methodology.

Download Presentation

Please find below an Image/Link to download the presentation.
The content on the website is provided AS IS for your information and personal use only. It may not be sold, licensed, or shared on other websites without obtaining consent from the author.If you encounter any issues during the download, it is possible that the publisher has removed the file from their server.
You are allowed to download the files provided on this website for personal or commercial use, subject to the condition that they are used lawfully. All files are the property of their respective owners.
The content on the website is provided AS IS for your information and personal use only. It may not be sold, licensed, or shared on other websites without obtaining consent from the author.
E N D
Presentation Transcript
The Risk Preparedness Methodologies Overview Stakeholder Webinar on Risk Preparedness Methodologies 5th September 2019 1
Electricity Risk Preparedness Regulation ENTSO-E to propose methodology for identifying crisis scenarios in a regional context, on the basis of the following risks: ENTSO-E to propose methodology for assessing short- term adequacy (seasonal to day ahead) which shall cover: Rare and extreme natural hazards; Uncertainty of inputs such as probability of transmission or generation unplanned outage, severe weather conditions and variability of demand; Accidental hazards going beyond the N-1 security criterion, and exceptional contingencies; Probability of crisis situation; Consequential hazards including consequences of Malicious attacks and of fuel shortages; Probability of simultaneous crisis situation. 2
RPR Project Status Report Status quo Way forward Next steps Methodologies have been reviewed within ENTSOE Shadow Opinion received from ACER and EC Methodologies submitted for public consultation via ENTSOE Consultation Hub Consultation to run from 8th July until 8th October Collation of consultation comments Presentation of comments back to ECG 19th November 2019 Amendments to Methodology following consultation. Submission to ACER of final methodologies by 5th January 2020 Webinar today Maintain close liaison with DG Energy & ACER 3
Methodology to Identify Regional Electricity Crisis Scenarios 4
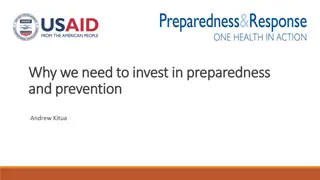
Key Methodology Overview ENTSO-E TSOs All 1. 2. 3. 4. 5. Article 7: Identification of national electricity crisis scenarios Article 8: Identification of regional electricity crisis scenarios Article 9: Evaluation of regional electricity crisis scenarios at a national level Article 10: Ranking of crisis scenarios by their regional impact Article 11: Presentation of most relevant scenarios Article 13: Handing of sensitive information Article 14: Publication and implementation of the methodology Article 12: Review Article 15: Language 5
Art. 7. Identification of national electricity crisis scenarios candidates Step 1 [TSOs] 1. Identification of crisis scenarios at a national level 2. Identification of cross-border dependencies 3. Description of a national electricity crisis scenario 4. Submission of national electricity crisis scenario National crisis scenarios candidates must be determined by the TSO(s) in close cooperation with the national competent authority The crisis scenarios should focus on electricity crises only historical electricity crises that may occur again (both experienced nationally and by other TSOs) available operational expertise and experience on credible future crisis scenarios interruption of cross-border supply and services that are heavily relied upon Cooperation between the Competent Authority and TSO is crucial to identify and define scenarios outside the scope of TSOs expertise For each national scenario that will be defined, cross-border dependencies are assessed 6
Art. 8 Identification of regional electricity crisis scenarios Step 2 [ENTSO-E] 1. Aggregation of national scenarios 2. Gap analysis 3. Inclusion of scenarios related to connected infrastructure 4. Finalisation The national electricity crisis scenarios are collated and combined by ENTSO-E Individual submissions from each TSO are quality checked in order to: TSOs to address the deficiency The national crisis scenarios are collated into respective regional scenarios Gap analysis shall be performed on a taxonomy of initiating events ENTSO-E shall consider infrastructure disruption scenarios, incl. those related to the natural gas supply, as developed by ENTSO-G and ESA report on nuclear fuel security of supply. ensure that the required data is completed identify scenarios not considered in national submissions that should be studied If national submissions are considered deficient, ENTSO-E shall ask the relevant 7
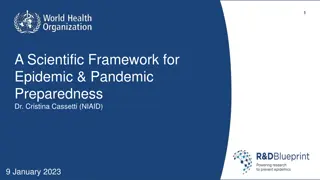
Art. 9 Evaluation of regional electr. crisis scen. at a national level Classification Events per year 0.5 Description/example of initiating event 1 x in years 2 or less Step 3 [TSOs] 1. Assessment of scenario impact per MS 2. Identification of cross-border impacts per MS 3. Submission of national crisis scenario assessments event expected practically every year, e.g. extreme winds/storms causing multiple failures of overhead lines may be expected nearly every year in some areas event expected once in a couple of years, e.g. extreme heat wave causing limits on output of open- loop water-cooled power plants, low water levels at hydro plants, higher load, etc. event expected or taken into consideration as a potential threat, e.g. cyber or malicious attack very rare event with potentially huge impact, e.g. simultaneous floods causing unavailability of generation, distribution and transmission infrastructure event not observed but potentially disastrous, e.g. earthquake causing a huge destruction of transmission, distribution and generation infrastructure Very likely 0.2-0.5 2-5 Likely 0.1-0.2 5-10 Possible 0.01-0.1 10-100 Unlikely 100 or more Very unlikely 0.01 Classification EENS%* LOLE* Each TSO should indicate, for their control areas, the likelihood and the impacts on the electricity system of each scenario identified .consistent with the rating scales provided (Appendix I), in terms of Expected Energy Not Supplied and Loss of load expectation. (of annual demand) 0,25% 0,05% and <0,025% 0,01% and <0,05% 0,002% and <0,01% <0,002% [hours] 168 48 and <168 12 and <48 3 and <12 <3 Disastrous Critical Major Minor Insignificant * EENS% is calculated by dividing expected energy not served for the duration of load curtailment by the total annual energy consumption of a Member State; LOLE (Loss of Load Expectation) is expressed in hours and represents the number of hours in which supply would not meet demand due to the crisis scenario 8
Art. 9 (continued) Impact Likelihood Very likely Very unlikely Minor Minor Minor Minor Minor Minor Minor Minor Minor Minor Minor Minor Minor Minor Minor Minor Insignificant Insignificant Insignificant Insignificant Insignificant Insignificant Insignificant Insignificant Insignificant EENS% LOLE Likely Possible Unlikely Step 3 [TSOs] (continued) Major Major Major Major Major Major Major Major Major Minor Minor Minor Minor Minor Minor Minor Minor Minor Minor Minor Minor Insignificant Insignificant Insignificant Insignificant Disastrous Disastrous Critical Disastrous Major Disastrous Minor Disastrous Insignificant Critical Critical Major Critical Minor Critical Insignificant Major Major Minor Major Insignificant Minor Minor Insignificant Insignificant Disastrous Critical Disastrous Major Disastrous Minor Disastrous Insignificant Disastrous Critical Major Critical Minor Critical Insignificant Critical Major Minor Major Insignificant Major Minor Insignificant Minor Insignificant Disastrous Disastrous Disastrous Disastrous Disastrous Disastrous Disastrous Disastrous Disastrous Disastrous Critical Critical Critical Critical Critical Critical Critical Major Major Major Major Major Major Major Minor Disastrous Critical Critical Critical Critical Critical Critical Critical Critical Critical Critical Critical Major Major Major Major Major Major Major Major Major Minor Minor Minor Minor Critical Critical Critical Major Major Major Major Major Major Major Major Major Major Major Major Major Major Minor Minor Minor Minor Minor Minor Minor Insignificant Note that EENS%, LOLE and likelihood all have impact on the overall scenario assessment On the impact scale, note that: LOLE expresses crisis duration but could amplify a prolonged problem of a very low magnitude EENS% will catch even a short-lived crisis impacting sufficiently large energy consumption volume
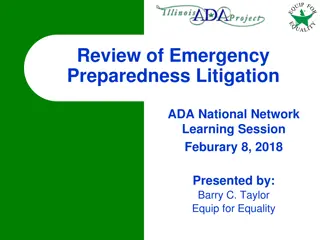
4. Ranking of regional crisis scenarios by their regional impact. (Art 10) Step 4 [ENTSO-E] 1. Gathering the national impact assessments per MS 2. Consistency Check of cross-border impacts 3. Evaluation of regional impacts 4. Ranking regional crisis scenarios according to their relevance Value Crisis scenario rating (used for regional scenario rating) Cross-border dependency rating Value None Minor Major Disastrous 10 x 1 Critical 5 1.2 2 Major 2 Minor 1 strength of the cross- border dependencies Insignificant 0 national scenario impact rating = The regional impact of each scenario is assessed using the following method: for each scenario, the national overall impact rating and overall rating of the strength of the cross- border dependencies is collected, Member State 1 Member State 2 Member State 3 Regional Rating Scenario Name Scenario Rating National rating Scenario Rating National rating Scenario Rating National rating CBD CBD CBD Fuel 1 1 1 5 1.2 6 10 2 20 27 Shortage Cyberattack 2 1.2 2.4 2 1 2 5 2 10 14.4 a rating of a scenario is calculated as a sum over all Member States of overall impact ratings weighted by the overall ratings of the strength of the cross-border dependencies . Heat wave 1 1.2 1.2 5 1.2 6 0 2 0 7.2 Cold spell 0 1 0 1 1 1 1 1 1 2 regional impact 10
Methodology for short term and seasonal adequacy assessments 11
Energy transition requires a robust methodology High spatial volatility High temporal volatility wind solar-small.png Probabilistic (hourly) Interconnections (Pan European)
Adequacy: different products for specific purposes 1 1 1 severalmonths several years Scope of this day week month Methodology Pan European Mid-Term Resource Adequacy Seasonal Adequacy Short-Term Adequacy Update inputs Update inputs when risk detected optional optional Regional or National Mid-Term regional sensitivity Seasonal regional sensitivity Intra-week regional adequacy The nearer to real time, the highest accuracy is required 13
Principle elements for adequacy Inadequate Adequate Storage Network Infrastructure Generation Demand Known Information: Capacities Planned Outages Known Information: Network availability Planned Outages Known Information: Demand profiles Demand side response Uncertainties: Wind generation Solar generation Forced outages Hydro energy availabilities Uncertainty: Forced Outages Uncertainty: Weather conditions 14
Legal document and explanatory note Methodology for short term and seasonal adequacy is described within 2 documents Non-binding Extended, with pictures and examples Updates after publication of additional examples through simpler process Legally binding Giving general framework that should also consider future evolutions Updates after publication would require general legal process Legal document Explanatory note 15
Structure of legal document Whereas; 1. Subject Matter and scope Legal Background (supported by Legal Advisers) Brief description and application scope 2. Definitions and interpretation Reference to other legal documents with common definitions Custom Definitions 3. Adequacy Assessment Description Main part of the document Generic description of Modelling Methodology 4. Seasonal adequacy assessment; 5. Short-term adequacy assessments Specific notes on each assessment Indicator description and adequacy analysis approach 6. Adequacy Assessment Process Data preparation, Probabilistic Modelling, Result Analysis, Report Drafting, Result Dissemination Supported by High-level information flow scheme in Appendix I & High-level Business process diagram in Appendix II 7. Publication and implementation Commitment to publish after approval of ACER Commitment to implement within 10 months after ACER s approval 16
Visualisation examples Seasonal Adequacy Assessment Short-term Adequacy Assessment Spatial screening on seasonal basis Hourly probabilistic screening specific sample (e.g. P50) Hourly screening Temporal screening 17
Risk preparedness strengthen further European cooperation through strong common methodologies Give your views on: the Methodology for identification of Electricity Crisis Scenarios at a regional level and the Methodology for short term and seasonal adequacy assessment Takeaways Public consultation on going until 8 October https://consultations.entsoe.eu/
Thank you for your attention Please send any questions to: Bruce.Riddington@sec.entsoe.eu or Alban.Joyeau@entsoe.eu 21


")