Risk Load and Reinsurance Rates for Property CAT Covers
 undefined


Ira Robbin, PhD
CAS Antitrust Notice
The Casualty Actuarial Society is committed to adhering
strictly to the letter and spirit of the antitrust laws. Seminars
conducted under the auspices of the CAS are designed solely
to provide a forum for the expression of various points of view
on topics described in the programs or agendas for such
meetings.
Under no circumstances shall CAS seminars be used as a
means for competing companies or firms to reach any
understanding – expressed or implied – that restricts
competition or in any way impairs the ability of members to
exercise independent business judgment regarding matters
affecting competition.
It is the responsibility of all seminar participants to be aware
of antitrust regulations, to prevent any written or verbal
discussions that appear to violate these laws, and to adhere
in every respect to the CAS antitrust compliance policy.
2
Disclaimers and Cautions
No statements of the Endurance corporate position or
the position of any prior employers will be made or
should be inferred.
No liability whatsoever is assumed for any damages,
either direct or indirect, that may be attributed to use
of the methods discussed in this presentation.
Writing CAT covers is risky – results may be
catastrophic to your bottom line.
Examples are for illustrative purposes only. Do not use
the results from any example in real-world
applications.
There may be a quiz at the end – so pay attention!
3
Agenda
-A Mix of Theory and Practice
CAT Pricing Process Fundamentals
Event Loss Table
Random Trials
CAT Context
Pricing Overview
Basic Equations
Required Capital Paradigms
Order Dependence and Reference Portfolios
Risk Measures
Properties
Take your pick
Ranking definitions of Var and TVaR
Conclusions
4
Event Loss Table
5
Occurrence Exceeding Probability OEP
6
EP(k) =
Prob(Largest Loss in a Year will equal or exceed the
kth largest loss in the event table)
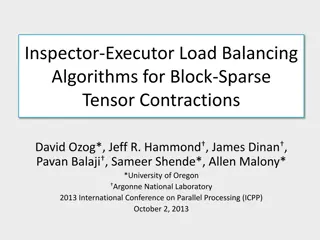
Random Trials
7
AEP and OEP PML from Ordered Trials
PML = Probable Maximum Loss
AEP = Annual Exceeding Probability
OEP = Occurrence Exceeding Probability
8
Context
CAT Pricing is part of the process of writing CAT
business, but not the only part.
Pricing models give indications – the market sets
the price.
Risk Management sets limits on PMLs and
TIV/Limit Aggregations by peril/zone .
Compliance monitoring essential
Business bunched –lots of 1/1s. Quotes go out
with authorized shares. By the time an account is
bound, the portfolio has changed.
Selection problem is constrained optimization:
Reinsurers looks to get most profitable portfolio
with smallest risk. No one prices that way.
9
Pricing Overview
Emerald City Pricing: Don’t look at that man
behind the curtain
Different vendor models
Some adopt new versions –others wait.
Differences in data quality
Loading factors
Non-modeled CAT events (Thai flood): Not always
priced
Ostrich Excuse - “It was not in the model”
Hiding-in-Plain-Sight Swan - May not show up on risk
management radar – obvious after the fact.
Pricing Method Flavors: Different ways of
translating model stats into indicated prices.
Can’t we just all agree?
10
Basic Equations
P= E[X]+ RL(X)
P = Indicated premium prior to expense loading
X = CAT Loss
RL(X) = Risk Load
RL(X) = r
target
*C(X)
C(X) = Required Capital
RORAC Approach
Universally used in actual CAT Treaty pricing
11
12
What is the right way to
compute Required CAT
Capital?
Required Capital Paradigms
Standalone: C(X) =
(X) , where is
(X) is a
risk measure.
Incremental: Let T be the existing portfolio
C(X|T) =
(T+X) -
(T)
,
Real Allocation
C(X|T) = A(X,T) *
(T+X)
13
Order Dependence and Reference
Portfolios
Order Dependence – Pricing depends on the order
in which accounts are priced (Mango)
Universe A : Zoe’s CAT Treaty is priced first at $100
then Jessica’s CAT Treaty is priced next at $150
Universe B: Jessica’s CAT Treaty is priced first at $100
then Zoe’s CAT Treaty is priced next at $150
A major problem for Incremental methods
A small problem for Allocation methods
Not a problem for Standalone
Reference Portfolio Cure
Portfolio fixed over a given period
How often should it be updated??
14
Risk Measure:
Definitions and properties
A
risk measure
,
, is a monotonic function that
maps a real-valued random variable, X, to a
non-negative number,
(X), such that:
Risk Measure Basic Properties
1.
Non-negative:
(X) ≥ 0
2.
Monotonic Premium: If X
1
X
2
, then
E[X
1
]+
(X
1
)
E[X
2
]+
(X
2
)
A risk measure is
pure
if it maps constants to
zero:
(c) = 0
15
Risk Measure:
Coherence properties
1.
Scalable:
(
X) =
(X)
2.
Translation Invariant:
(X+
) =
(X)
3.
Subadditive:
(X
1
+ X
2
) ≤
(X
1
) +
( X
2
)
Some academicians refuse to refer to a
function as a risk measure unless it is coherent
Most academicians uses reverse signs ( X
represents the value of assets instead of CAT
losses)
16
Risk Measures: Take Your Pick
1.
Variance: Var(X) =E[(X-
2.
Semivariance: Var
+
(X): E[(X-
| X≥
]*Prob(X ≥
)
3.
Standard Deviation:
= Var
½
(X)
4.
Semi Standard Deviation:
= Var
½
(X)
5.
Value at Risk: for 0<
< 1 , VaR(
) =
sup{x| F(x)≤ }
6.
Tail Value at Risk: TVaR(
) = conditional mean for all x
values associated with the tail, 1- , of probability
7.
Excess Tail Value at Risk: XTVaR(
) =
TVaR(
) -
8.
Distortion Risk Measure: (Wang) E*[X] = E[X*] where
F*(x) = g(F(X)) for g a distortion function
9.
Excess Distortion Risk Measure: E*[X] –E[X]
17
Ranking Definition of VaR and TVaR on
Random Sample Data
Let
X
1
≥ X
2 …
≥
X
n
be an ordering of n trials of X
Suppose k = (1 -
)n
18
Note TVaR is
not
necessarily equal to the Conditional
Tail Expectation (CTE) when the data is discrete.
CTE(
) =
E[X|X>VaR(
) ]
TVaR and CTE -not the same
19
VaR Subadditivity-Epic Fail
20
Real Allocation Approaches
1.
Stand-alone Risk Measure as Allocation Base
2.
Marginal Risk Measure as Allocation Base
Adjusted for Order Dependence (Mango)
3.
Game theory –(LeMaire) Allocation of Portfolio
Consolidation Benefit
4.
Co-Measures – (Kreps)
5.
Percentile Allocation (Bodoff)
21
Co-VaR Instability
22
Conclusions
Target return on required capital is the basis
for reinsurer pricing indications.
Debate is over required capital
A profusion of methods and approaches
Tail focus and portfolio dependence are key
areas of disagreement.
Some of the most popular methods fail to
satisfy one or more basic properties
23
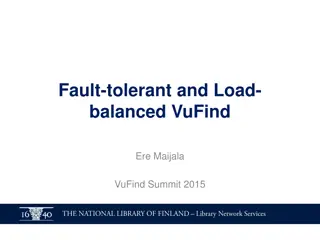
This seminar explores how reinsurers factor in risk load and cost of capital when determining reinsurance rates for property catastrophe covers. The content includes discussions on CAT pricing fundamentals, event loss tables, random trials, basic equations, and more, presented by Dr. Ira Robbin. Disclaimer cautions against the direct application of methods discussed, emphasizing the importance of understanding the pricing process and risk measures in CAT covers.

Download Presentation

Please find below an Image/Link to download the presentation.
The content on the website is provided AS IS for your information and personal use only. It may not be sold, licensed, or shared on other websites without obtaining consent from the author.If you encounter any issues during the download, it is possible that the publisher has removed the file from their server.
You are allowed to download the files provided on this website for personal or commercial use, subject to the condition that they are used lawfully. All files are the property of their respective owners.
The content on the website is provided AS IS for your information and personal use only. It may not be sold, licensed, or shared on other websites without obtaining consent from the author.
E N D
Presentation Transcript
CAS RATEMAKING AND PRODUCT MANAGEMENT SEMINAR- MARCH 2012 RR-2: RISK LOAD/COST OF CAPITAL: HOW REINSURERS CONSIDER THESE IN REINSURANCE RATES FOR PROPERTY CAT COVERS Ira Robbin, PhD
2 CAS Antitrust Notice The Casualty Actuarial Society is committed to adhering strictly to the letter and spirit of the antitrust laws. Seminars conducted under the auspices of the CAS are designed solely to provide a forum for the expression of various points of view on topics described in the programs or agendas for such meetings. Under no circumstances shall CAS seminars be used as a means for competing companies or firms to reach any understanding expressed or implied that restricts competition or in any way impairs the ability of members to exercise independent business judgment regarding matters affecting competition. It is the responsibility of all seminar participants to be aware of antitrust regulations, to prevent any written or verbal discussions that appear to violate these laws, and to adhere in every respect to the CAS antitrust compliance policy. 2
3 Disclaimers and Cautions No statements of the Endurance corporate position or the position of any prior employers will be made or should be inferred. No liability whatsoever is assumed for any damages, either direct or indirect, that may be attributed to use of the methods discussed in this presentation. Writing CAT covers is risky results may be catastrophic to your bottom line. Examples are for illustrative purposes only. Do not use the results from any example in real-world applications. There may be a quiz at the end so pay attention! 3
4 Agenda -A Mix of Theory and Practice CAT Pricing Process Fundamentals Event Loss Table Random Trials CAT Context Pricing Overview Basic Equations Required Capital Paradigms Order Dependence and Reference Portfolios Risk Measures Properties Take your pick Ranking definitions of Var and TVaR Conclusions 4
Event Loss Table Total Event Rank 1 2 3 4 5 6 7 8 9 10 . . . 1998 1999 2000 Annual Prob 0.021% 0.040% 0.080% 0.070% 0.045% 0.055% 0.006% 0.150% 0.010% 0.025% . . . 2.000% 4.000% 3.000% Treaty A Loss Treaty B Loss 1,200 1,000 Treaty C Loss Portfolio Loss 125,000 100,000 90,000 80,000 75,000 70,000 60,000 50,000 50,000 40,000 . . . Peril EQ EQ HU EQ HU EQ EQ HU EQ EQ . . . HU HU HU Region CA CA FLA CA LA CA PNW FLA PNW AK . . . NC FL SC 300 0 0 0 0 0 3,000 900 400 0 0 0 0 2,100 700 500 100 900 5,500 . . . 700 0 0 0 0 400 550 0 0 . . . . . . 0 0 0 0 0 0 2 2 0 3 2 1 5
Occurrence Exceeding Probability OEP EP(k) k p(k) Exceeding Probability Portfolio Event Loss 125,000 100,000 90,000 80,000 75,000 70,000 60,000 50,000 50,000 40,000 . . . Event Rank 1 2 3 4 5 6 7 8 9 10 . . . 1998 1999 2000 Peril EQ EQ HU EQ HU EQ EQ HU EQ EQ . . . HU HU HU Region CA CA FLA CA LA CA PNW FLA PNW AK . . . NC FL SC Annual Prob 0.021% 0.040% 0.080% 0.070% 0.045% 0.055% 0.006% 0.150% 0.010% 0.025% . . . 2.000% 4.000% 3.000% 0.021% 0.061% 0.141% 0.211% 0.256% 0.311% 0.317% 0.466% 0.476% 0.501% 24.000% 27.040% 29.229% 3 2 1 EP(k) = Prob(Largest Loss in a Year will equal or exceed the kth largest loss in the event table) + = + + ( 1) ( ) (1 ( )) ( 1) EP k EP k EP k p k 6
Random Trials Trial Year 1 2 3 4 5 6 7 8 9 10 . . . 9998 9999 10000 Largest Event over the Year Total Annual Event 1 40,000 2,100 5,500 1,250 8,750 . Event 2 3,500 27,550 3,500 . Event 3 - 70,000 . Loss - - 450 - - - 40,000 3,500 40,000 6,050 - - - 0 0 27,550 700 1,250 8,750 70,000 33,050 1,150 2,175 8,750 70,120 700 400 900 - 45 - 50 25 - 75 - - 0 0 15 45 3,500 3,560 . . . . . . 25 550 650 - - - - 25 25 7,750 - 7,750 650 8,300 650 7
AEP and OEP PML from Ordered Trials Trial Year Rank 1 2 3 4 5 6 7 8 9 10 . . . 99 100 101 . . . 9998 9999 10000 Largest Event Total Annual Loss 125,000 125,000 125,000 100,000 100,000 100,000 90,000 90,000 90,000 90,000 . . . 21,250 21,000 21,000 . . . - - - 175,000 170,000 165,000 137,500 135,000 130,000 125,000 115,000 110,000 110,000 . . . 100/10000 = 1.0% 100 year return period AEP PML =36,675 OEP PML= 21,000 37,500 36,675 35,950 . . . 0 0 0 PML = Probable Maximum Loss AEP = Annual Exceeding Probability OEP = Occurrence Exceeding Probability 8
Context CAT Pricing is part of the process of writing CAT business, but not the only part. Pricing models give indications the market sets the price. Risk Management sets limits on PMLs and TIV/Limit Aggregations by peril/zone . Compliance monitoring essential Business bunched lots of 1/1s. Quotes go out with authorized shares. By the time an account is bound, the portfolio has changed. Selection problem is constrained optimization: Reinsurers looks to get most profitable portfolio with smallest risk. No one prices that way. 9
Pricing Overview Emerald City Pricing: Don t look at that man behind the curtain Different vendor models Some adopt new versions others wait. Differences in data quality Loading factors Non-modeled CAT events (Thai flood): Not always priced Ostrich Excuse - It was not in the model Hiding-in-Plain-Sight Swan - May not show up on risk management radar obvious after the fact. Pricing Method Flavors: Different ways of translating model stats into indicated prices. Can t we just all agree? 10
Basic Equations P= E[X]+ RL(X) P = Indicated premium prior to expense loading X = CAT Loss RL(X) = Risk Load RL(X) = rtarget*C(X) C(X) = Required Capital RORAC Approach Universally used in actual CAT Treaty pricing 11
What is the right way to compute Required CAT Capital? 12
Required Capital Paradigms Standalone: C(X) = (X) , where is (X) is a risk measure. Incremental: Let T be the existing portfolio C(X|T) = (T+X) - (T), Real Allocation C(X|T) = A(X,T) * (T+X) 13
Order Dependence and Reference Portfolios Order Dependence Pricing depends on the order in which accounts are priced (Mango) Universe A : Zoe s CAT Treaty is priced first at $100 then Jessica s CAT Treaty is priced next at $150 Universe B: Jessica s CAT Treaty is priced first at $100 then Zoe s CAT Treaty is priced next at $150 A major problem for Incremental methods A small problem for Allocation methods Not a problem for Standalone Reference Portfolio Cure Portfolio fixed over a given period How often should it be updated?? 14
Risk Measure: Definitions and properties A risk measure, , is a monotonic function that maps a real-valued random variable, X, to a non-negative number, (X), such that: Risk Measure Basic Properties 1. Non-negative: (X) 0 2. Monotonic Premium: If X1 X2, then E[X1]+ (X1) E[X2]+ (X2) A risk measure is pure if it maps constants to zero: (c) = 0 15
Risk Measure: Coherence properties 1. Scalable: ( X) = (X) 2. Translation Invariant: (X+ ) = (X) 3. Subadditive: (X1 + X2) (X1 ) + ( X2) Some academicians refuse to refer to a function as a risk measure unless it is coherent Most academicians uses reverse signs ( X represents the value of assets instead of CAT losses) 16
Risk Measures: Take Your Pick 1. Variance: Var(X) =E[(X- ) 2. Semivariance: Var+(X): E[(X- ) | X ]*Prob(X ) 3. Standard Deviation: = Var (X) 4. Semi Standard Deviation: + = Var + (X) 5. Value at Risk: for 0< < 1 , VaR( ) = sup{x| F(x) } 6. Tail Value at Risk: TVaR( ) = conditional mean for all x values associated with the tail, 1- , of probability 7. Excess Tail Value at Risk: XTVaR( ) = TVaR( ) - 8. Distortion Risk Measure: (Wang) E*[X] = E[X*] where F*(x) = g(F(X)) for g a distortion function 9. Excess Distortion Risk Measure: E*[X] E[X] ( ) X : [ Variance E 17
18 Ranking Definition of VaR and TVaR on Random Sample Data Let X1 X2 Xn be an ordering of n trials of X Suppose k = (1 - )n = ( ) VaR X k 1 k k = ( ) TVaR X j = 1 j Note TVaR is not necessarily equal to the Conditional Tail Expectation (CTE) when the data is discrete. CTE( ) = E[X|X>VaR( ) ] 18
TVaR and CTE -not the same Statistic Value 10 50% Results Mean VaR TVaR CTE A Ref A+Ref 28.80 34.00 35.40 35.75 Trials Pct Rank 2.80 2.00 5.00 5.75 26.00 33.00 34.80 36.00 5 Loss Data by Trial Ordered Loss Data Trial 1 2 3 4 5 6 7 8 9 10 A Ref A+Ref 20.00 37.00 36.00 35.00 34.00 19.00 23.00 35.00 31.00 18.00 Rank A Ref A+Ref 37.00 36.00 35.00 35.00 34.00 31.00 23.00 20.00 19.00 18.00 8.00 0.00 0.00 0.00 1.00 2.00 7.00 2.00 4.00 4.00 12.00 37.00 36.00 35.00 33.00 17.00 16.00 33.00 27.00 14.00 1 2 3 4 5 6 7 8 9 8.00 7.00 4.00 4.00 2.00 2.00 1.00 0.00 0.00 0.00 37.00 36.00 35.00 33.00 33.00 27.00 17.00 16.00 14.00 12.00 10 19
VaR Subadditivity-Epic Fail Statistic Trials Pct Rank Value 10 50% Results Mean VaR TVaR A Ref A+Ref 28.80 37.00 39.40 2.80 2.00 5.00 26.00 33.00 34.80 5 Loss Data by Trial Ordered Loss Data Trial 1 2 3 4 5 6 7 8 9 10 A Ref A+Ref 12.00 37.00 44.00 42.00 37.00 19.00 16.00 37.00 29.00 15.00 Rank A Ref A+Ref 44.00 42.00 37.00 37.00 37.00 29.00 19.00 16.00 15.00 12.00 0.00 0.00 8.00 7.00 4.00 2.00 0.00 4.00 2.00 1.00 12.00 37.00 36.00 35.00 33.00 17.00 16.00 33.00 27.00 14.00 1 2 3 4 5 6 7 8 9 8.00 7.00 4.00 4.00 2.00 2.00 1.00 0.00 0.00 0.00 37.00 36.00 35.00 33.00 33.00 27.00 17.00 16.00 14.00 12.00 10 20
21 Real Allocation Approaches 1. Stand-alone Risk Measure as Allocation Base 2. Marginal Risk Measure as Allocation Base Adjusted for Order Dependence (Mango) 3. Game theory (LeMaire) Allocation of Portfolio Consolidation Benefit 4. Co-Measures (Kreps) 5. Percentile Allocation (Bodoff) 21
Co-VaR Instability VaR Portfolio Loss Risk A Loss Rank 1 Percentage 98 99 100 101 102 99.02% 99.01% 99.00% 98.99% 98.98% $422 $408 $405 $395 $390 $6 $0 $20 $0 $4 10,000 22
23 Conclusions Target return on required capital is the basis for reinsurer pricing indications. Debate is over required capital A profusion of methods and approaches Tail focus and portfolio dependence are key areas of disagreement. Some of the most popular methods fail to satisfy one or more basic properties 23