Regional Data Exploration: SET Overview & Economic Development Plan


SET Overview and
Exploration of
Regional Data
Session 1
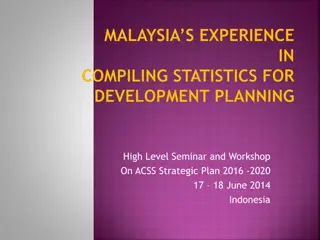
The SET Process
You are here
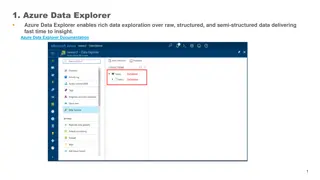
Today, We Will
•
Review the Regional SET Forum
•
Explore the regional economic
data:
•
Regional industry clusters
•
Employment and occupation
•
Chart the next steps
SET Purpose: Doing Better Together
The regional team
develops and implements a
High Quality Regional
Economic Development Plan
that builds on the region’s current
and emerging economic strengths.
High Quality Plan: Essential Components
Guiding Principles for Our Discussions
Sample ideas:
•
Enter into the discussion enthusiastically.
•
Give freely of your experience.
•
Allow and encourage others to contribute.
•
Listen attentively and take accurate notes.
•
Ask questions when you don’t understand.
•
Appreciate the other person’s point of view.
•
Provide constructive feedback and receive it willingly.
•
Keep confidences and assume others will.
•
Confine your discussion to the topic.
Round I: Forum Review
Civic Engagement Forum Review
•
Regional Strengths & Challenges
•
Data Snapshot Reactions
•
Opportunities
Round II: Economic Data
Data Scavenger Hunt: Thriving Businesses
•
Number of employees
•
Workforce skills needed
•
Type of business (i.e.
manufacturing, retail, health
services)
•
Average earnings
•
County
•
Size
•
Large=over 100 employees
•
Small= under 100
•
Other businesses/industries for
which it is providing support
Getting the Big Picture in Mind
•
What are the region’s largest
businesses and industries?
•
What goods and services do they
purchase?
•
Are these products/services
available within the region?
•
What other businesses connect
to each of these larger ones?
Round III: Explain, Examine, and Explore
COACHES: Insert regional data
in place of sample tables
throughout this section
Industry & Occupation
Components of changes in Jobs
•
Source: YourEconomy.org
Industry and occupation
section 02
Note: YourEconomy has changed its data source from NETS to InfoUSA on August, 2016. Based on the data
available, we can only estimate churn based on jobs and not establishments.
•
How to Interpret the Accompanying
Table
•
New Startups
: A completely new
business from births/openings
without any affiliation to an existing
business.
•
Spinoffs
: New businesses that were
spun-off from existing businesses.
•
Expansions
: Existing businesses that
have expanded in jobs.
•
In-migration
: Businesses that have
moved-in from outside of the county.
•
Closings
: Closure of existing
businesses.
•
Contractions
: Existing businesses that
have shed/reduced jobs.
•
Out-migration
: Businesses that have
moved-out from the county.
•
Economy
•
Source: YourEconomy.org
section 03
Definition of Company Stages
0 1
2
3
4
Self-
employed
2-9
employees
10-99
employees
100-499
employees
500+
employees
Company stages
Establishment Distribution by Stages
Indiana, 2015
Note: Based on Edward Lowe’s research,
http://thegrowthsociety.com/links/SecondStage.pdf
Source: Pyramid graphics is courtesy of Nancy Duarte,
http://www.duarte.com/diagrammer/
Industry and occupation
section 02
Establishments
Source: Youreconomy.org
database
Questions:
•
What stage businesses have shaped the region’s economic growth in the last 6 years?
•
Which ones are growing or declining the most?
•
Which stage of establishments are likely to shape the region’s future economic growth?
Industry and occupation
section 02
Jobs and Sales
Source: Youreconomy.org
database
Questions
•
What establishments are the
most numerous based on
company stages?
•
What stages have
experienced the largest
growth? The greatest
decline?
•
What company stage
employs the largest number
of people?
•
What stage captures the
most sales?
•
Which ones have
experienced the greatest
percentage loss over the
2009-2015 period?
Industry and occupation
section 02
Top ten industry sector employment growth
Source: EMSI Class of Worker 2016.4 (QCEW, non-QCEW, self-employed and extended proprietors)
Questions:
•
What regional industry sectors have seen the greatest growth?
•
Did they grow at the same rate as the state?
•
What factors are causing the growth?
Industry and occupation
section 02
Seven industry sector employment decline
Source: EMSI Class of Worker 2016.4 (QCEW, non-QCEW, self-employed and extended proprietors)
Questions:
•
How does the industry sector make-up of the region compare to the rest of the state?
•
Which industry sectors are growing and declining the most in employment?
Exploring Industry Clusters
Industrial Clusters
Clusters are groups of inter-related industries that drive wealth creation in a
region, primarily through export of goods and services.
Vertical Clusters
•
Represents the entire value chain
of a broadly defined industry
from suppliers to end products.
•
Examples:
•
Auto manufacturing (glass, paint,
engine, plastic, etc. that goes into
making a car)
•
Healthcare (service providers,
equipment, medical supplies,
pharmaceuticals)
Horizontal Clusters
•
Groups of similar industries that use
the same resources including raw
materials and/or labor
•
Examples:
•
Silicon Valley
•
Wall Street Financial District
•
Napa Valley Wine Region
Example of a Vertical Cluster
Example of a Horizontal Cluster
LIST OF CLUSTERS
•
Advanced Materials
•
Agribusiness, Food Processing &
Technology
•
Apparel & Textiles
•
Arts, Entertainment, Recreation &
Visitor Industries
•
Biomedical/Biotechnical (Life Sciences)
•
Business & Financial Services
•
Chemicals
•
Computer & Electronic Product
Manufacturing
•
Defense & Security
•
Education & Knowledge Creation
•
Electrical Equip, Appliance &
Component Manufacturing
•
Fabricated Metal Product
Manufacturing
•
Energy (Fossil & Renewable)
•
Forest & Wood Products
•
Glass & Ceramics
•
Information Technology &
Telecommunications
•
Machinery Manufacturing
•
Manufacturing Super-cluster
•
Mining
•
Primary Metal Manufacturing
•
Printing & Publishing
•
Transportation & Logistics
•
Transportation Equipment
Manufacturing
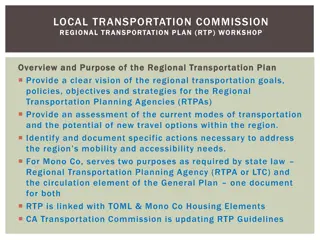
How to interpret cluster data results
The graph’s four quadrants tell a different story for each cluster.
Industry cluster analysis
section 03
Modified from:
http://www.charlestonregionaldata.com/bubble-chart-explanation
/
Contains clusters that are more
concentrated in the region and are
growing. These clusters are
strengths that help a region
stand out from the competition.
Small, high-growth clusters
can be expected to become
more dominant over time.
Contains clusters that are more
concentrated in the region but
are declining (negative growth).
These clusters typically fall
into the lower quadrant as
job losses cause a decline
in concentration.
Contains clusters that are
under-represented in the
region but are growing, often
quickly. If growth trends
continue, these clusters will
eventually move into the top right
quadrant. Clusters in this quadrant
are considered emerging strengths
for the region.
Contains clusters that are
under-represented in the
region (low concentration)
and are also losing jobs.
Clusters in this region may
indicate a gap in the workforce
pipeline if local industries anticipate
a future need. In general, clusters in this
quadrant show a lack of
competitiveness.
Industry cluster analysis
section 03
NOTE: The first number after each cluster represents the number of total jobs (full and part time jobs by place of work) in that cluster in the region in 2015. The clusters are
sorted in decreasing order by location quotient as shown in the bubble chart.
Percent Growth in Specialization
Level of Specialization
Industry Cluster Bubble Chart
Note to coaches: If you are planning to show the bubble chart(s) to
the entire regional team, insert the additional slides from the Data
SnapShot: Session 1 here.
This includes data slides with these titles:
•
Bubble Chart: What to Look at First
•
Industry Cluster Bubble Chart
•
The Manufacturing Super-Cluster (if relevant)
•
Manufacturing Sub-cluster Bubble Chart (if relevant).
If you are only showing these to a smaller data team, just delete this
slide.
Exploring Occupations
Industry and occupation
section 04
Top five occupations in 2015
Questions
:
•
What are the education and
skill requirements for these
occupations?
•
Do the emerging and star
clusters align with the top
occupations?
•
What type salaries do these
occupations typically provide?
Source: EMSI Class of Worker 2016.4 (QCEW, non-QCEW, self-employed and extended proprietors)
Industry and occupation
section 04
Science, Technology, Engineering & Math
Questions
:
•
How do STEM jobs compare to the state?
•
What has been the trend of STEM jobs over time?
•
How important are STEM jobs to the region’s Star and Emerging clusters?
*Note: STEM and STEM-related occupation definitions from BLS (2010)
Source: EMSI Class of Worker 2016.4 (QCEW, non-QCEW, self-employed and extended proprietors)
Workforce Data
•
What are the region’s
unemployment
trends?
•
Are more people
commuting into the
region or commuting
out?
•
How do regional
earnings compare to
the state or nation?
Cluster Analysis Dashboard
Coaches, replace
this chart with the
one for your
region.
Honing in on Key Clusters
Based on the
assets of the
region and
current
industrial
trends…
What clusters
should this
region explore
further?
Reality Check and Next Steps
Did the data reveal:
•
Any new opportunities
that should be
considered?
•
The need to eliminate
previously considered
opportunities?
•
New partners that need
to be included in the
planning process.
Actions: Begin Writing the Plan
•
Describe and summarize the Civic
Engagement Forum process and
results.
•
Summarize key strengths and
challenges based on the data
•
Describe the selected clusters:
•
Why were these clusters selected for
further exploration?
•
What are the strengths and challenges
associated with the selected clusters?
•
Which suggested opportunities are
associated with each selected cluster?
Have this slide up when participants arrive.
Goal: Begin the process of building rapport among the group members.
The introductions can take too long if the group is large, but the participants may not know each other so taking time to facilitate introductions will be important. Feel free to use whatever process you prefer. Here are some suggested approaches to consider:
• Ask individuals to introduce themselves to people around them in small groups, then have a spokesperson introduce everyone in the group simply providing name and organization.
• Allow time for everyone to introduce him/herself to the full group (name & county).
Important note: If the group is very large, introductions need to be managed well to avoid too much time loss. Consider using a model like: Give your name, organization and one word that describes what you hope SET will do. [Model the behavior so people will see that you want it short.]
Time: 10 Minutes
Dive into regional data exploration with SET, covering economic development plans, high-quality strategies, and civic engagement forums. Learn about regional strengths, challenges, and data scavenger hunts to identify thriving businesses and workforce skills needed for growth.

Download Presentation

Please find below an Image/Link to download the presentation.
The content on the website is provided AS IS for your information and personal use only. It may not be sold, licensed, or shared on other websites without obtaining consent from the author. Download presentation by click this link. If you encounter any issues during the download, it is possible that the publisher has removed the file from their server.
E N D
Presentation Transcript
SET Overview and Exploration of Regional Data Session 1
The SET Process You are here
Today, We Will Review the Regional SET Forum Explore the regional economic data: Regional industry clusters Employment and occupation Chart the next steps
SET Purpose: Doing Better Together The regional team develops and implements a High Quality Regional Economic Development Plan that builds on the region s current and emerging economic strengths.
High Quality Plan: Essential Components Evidence-Based Practical Team s Regional Plan Aligned with Goals Broadly Supported Focused on Regional Economic Development
Guiding Principles for Our Discussions Sample ideas: Enter into the discussion enthusiastically. Give freely of your experience. Allow and encourage others to contribute. Listen attentively and take accurate notes. Ask questions when you don t understand. Appreciate the other person s point of view. Provide constructive feedback and receive it willingly. Keep confidences and assume others will. Confine your discussion to the topic.
Civic Engagement Forum Review Regional Strengths & Challenges Data Snapshot Reactions Opportunities
Data Scavenger Hunt: Thriving Businesses Number of employees Workforce skills needed Type of business (i.e. manufacturing, retail, health services) Average earnings County Size Large=over 100 employees Small= under 100 Other businesses/industries for which it is providing support
Getting the Big Picture in Mind What are the region s largest businesses and industries? What goods and services do they purchase? Are these products/services available within the region? What other businesses connect to each of these larger ones?
Round III: Explain, Examine, and Explore COACHES: Insert regional data in place of sample tables throughout this section
Industry and occupation Components of changes in Jobs How to Interpret the Accompanying Table New Startups: A completely new business from births/openings without any affiliation to an existing business. Spinoffs: New businesses that were spun-off from existing businesses. Expansions: Existing businesses that have expanded in jobs. In-migration: Businesses that have moved-in from outside of the county. Closings: Closure of existing businesses. Contractions: Existing businesses that have shed/reduced jobs. Out-migration: Businesses that have moved-out from the county. Changes in Jobs (2009-2015) +17,824 New Startups +5,385 Spinoffs Gained by +9,689 Expansion +843 In-migration -23,535 Closings Lost by -7,692 Contractions -532 Out-migration +1,982 +1,982 Net change section 02 Source: YourEconomy.org Note: YourEconomy has changed its data source from NETS to InfoUSA on August, 2016. Based on the data available, we can only estimate churn based on jobs and not establishments. 14
Economy Company stages An establishment is a physical business location. Branches, standalones and headquarters are all considered types of establishments. Definition of Company Stages 0 1 2 3 4 Self- employed 2-9 employees 10-99 employees 100-499 employees 500+ employees Establishment Distribution by Stages Indiana, 2015 section 03 Note: Based on Edward Lowe s research, http://thegrowthsociety.com/links/SecondStage.pdf Source: Pyramid graphics is courtesy of Nancy Duarte, http://www.duarte.com/diagrammer/ Source: YourEconomy.org 15
Industry and occupation Establishments Number of Establishments by Company Stages 2009 Establishments Proportion 967 15% 2015 Stage Stage 0 Establishments Proportion 981 14% Stage 1 4,128 66% 4,847 69% Stage 2 1,065 17% 1,115 16% Stage 3 79 1% 78 1% Stage 4 9 0.1% 7 0.1% Total 6,248 100% 7,028 100% Questions: What stage businesses have shaped the region s economic growth in the last 6 years? Which ones are growing or declining the most? Which stage of establishments are likely to shape the region s future economic growth? section 02 Source: Youreconomy.org database 16
Industry and occupation Jobs and Sales Questions What establishments are the most numerous based on company stages? Number of Jobs by Company Stages Year Stage 0 Stage 1 Stage 2 Stage 3 Stage 4 Total 2009 967 2015 1,017 18,684 26,052 13,061 13,720 72,534 % Change 5.2% 17.6% -2.9% 4.7% -4.8% 2.8% What stages have experienced the largest growth? The greatest decline? 15,884 26,820 12,475 14406 70,552 What company stage employs the largest number of people? Sales ($Billion, 2015) by Company Stages Year Stage 0 2009 0.19 3.42 4.80 2.83 2.05 13.29 2015 0.2 4.2 6.0 2.4 0.7 13.54 % Change -12% 23% 25% -14% -65.6% What stage captures the most sales? Which ones have experienced the greatest percentage loss over the 2009-2015 period? Stage 1 Stage 2 Stage 3 Stage 4 Total 2% section 02 Source: Youreconomy.org database 17
Industry and occupation Top ten industry sector employment growth State NAICS Description 2009 Jobs 2015 Jobs Change Change (%) Change (%) 31 21 55 22 53 11 Manufacturing Mining, Quarrying, and Oil and Gas Extraction Management of Companies and Enterprises Utilities Real Estate and Rental and Leasing Crop and Animal Production Administrative and Support and Waste Management and Remediation Services Construction Accommodation and Food Services Health Care and Social Assistance 6,376 1,821 145 401 1,665 4,151 8,111 2,262 179 493 1,857 4,561 1,735 441 27% 24% 23% 23% 12% 10% 18% 36% 20% -9% 5% 2% 34 92 192 410 56 2,007 2,204 197 10% 25% 23 72 62 4,680 4,425 6,704 5,020 4,721 7,068 340 296 364 7% 7% 5% 2% 11% 9% Questions: What regional industry sectors have seen the greatest growth? Did they grow at the same rate as the state? What factors are causing the growth? section 02 Source: EMSI Class of Worker 2016.4 (QCEW, non-QCEW, self-employed and extended proprietors) 18
Industry and occupation Seven industry sector employment decline State NAICS Description 2009 Jobs 2015 Jobs Change Change (%) Change (%) 51 Information 620 503 -117 -19% -7% 54 Professional, Scientific, and Technical Services 3,538 2,980 -558 -16% 9% 52 Finance and Insurance 2,309 2,128 -181 -8% 1% 71 Arts, Entertainment, and Recreation 651 608 -43 -7% 1% 42 Wholesale Trade 1,743 1,655 -88 -5% 3% 90 Government 16,289 15,858 -431 -3% -3% 81 Other Services (except Public Administration) 4,691 4,650 -41 -1% 5% Questions: How does the industry sector make-up of the region compare to the rest of the state? Which industry sectors are growing and declining the most in employment? section 02 Source: EMSI Class of Worker 2016.4 (QCEW, non-QCEW, self-employed and extended proprietors) 19
Industrial Clusters Clusters are groups of inter-related industries that drive wealth creation in a region, primarily through export of goods and services. Vertical Clusters Represents the entire value chain of a broadly defined industry from suppliers to end products. Horizontal Clusters Groups of similar industries that use the same resources including raw materials and/or labor Examples: Auto manufacturing (glass, paint, engine, plastic, etc. that goes into making a car) Healthcare (service providers, equipment, medical supplies, pharmaceuticals) Examples: Silicon Valley Wall Street Financial District Napa Valley Wine Region
LIST OF CLUSTERS Advanced Materials Agribusiness, Food Processing & Technology Apparel & Textiles Arts, Entertainment, Recreation & Visitor Industries Biomedical/Biotechnical (Life Sciences) Business & Financial Services Chemicals Computer & Electronic Product Manufacturing Defense & Security Education & Knowledge Creation Electrical Equip, Appliance & Component Manufacturing Fabricated Metal Product Manufacturing Energy (Fossil & Renewable) Forest & Wood Products Glass & Ceramics Information Technology & Telecommunications Machinery Manufacturing Manufacturing Super-cluster Mining Primary Metal Manufacturing Printing & Publishing Transportation & Logistics Transportation Equipment Manufacturing
Industry cluster analysis How to interpret cluster data results The graph s four quadrants tell a different story for each cluster. Contains clusters that are more concentrated in the region but are declining (negative growth). These clusters typically fall into the lower quadrant as job losses cause a decline in concentration. Contains clusters that are more concentrated in the region and are growing. These clusters are strengths that help a region stand out from the competition. Small, high-growth clusters can be expected to become more dominant over time. Mature Top left (strong but declining) Stars Top right (strong and advancing) Emerging Bottom right (weak but advancing) Transforming Bottom left (weak and declining) Contains clusters that are under-represented in the region (low concentration) and are also losing jobs. Clusters in this region may indicate a gap in the workforce pipeline if local industries anticipate a future need. In general, clusters in this quadrant show a lack of competitiveness. Contains clusters that are under-represented in the region but are growing, often quickly. If growth trends continue, these clusters will eventually move into the top right quadrant. Clusters in this quadrant are considered emerging strengths for the region. section 03 Modified from: http://www.charlestonregionaldata.com/bubble-chart-explanation/ 25
Industry cluster analysis Mature Clusters Star Clusters Glass & Ceramics (3.91 Mining (1.69 1.69; 381) Energy (Fossil & Renewable) (1.3 Transportation & Logistics (1.02 3.91; 482) Primary Metal Manufacturing (4.66 Agribusiness, Food Processing & Tech. (2.96 Transportation Equipment Mfg. (1.91 Forest & Wood Products (1.76 Chemicals & Chemical Based Products (1.72 Advanced Materials (1.27 1.27; 2,796) Fabricated Metal Product Mfg. (1.21 4.66; 757) Level of Specialization 2.96; 6,604) 1.3; 5,326) 1.02; 2,482) 1.91; 1,265) 1.76; 1,970) 1.72; 1,556) 1.21; 729) Percent Growth in Specialization Transforming Clusters Emerging Clusters Biomedical/Biotechnical (0.82 0.82; 4,780) Machinery Manufacturing (0.92 0.92; 443) Business & Financial Services (0.49 0.49; 4,676) Printing & Publishing (0.43 0.43; 545) Apparel & Textiles (0.47 0.47; 267) Electrical Equip, App & Comp Mfg. (0.02 0.02; 3) Defense & Security (0.47 0.47; 1,489) Education & Knowledge Creation (0.38 0.38; 672) Arts, Ent, Rec & Visitor Industries (0.37 0.37; 1,130) IT & Telecommunications (0.29 0.29; 884) Computer & Electronic Product Mfg. (0.15 0.15; 65) section 03 NOTE: The first number after each cluster represents the number of total jobs (full and part time jobs by place of work) in that cluster in the region in 2015. The clusters are sorted in decreasing order by location quotient as shown in the bubble chart. 26
Industry Cluster Bubble Chart Note to coaches: If you are planning to show the bubble chart(s) to the entire regional team, insert the additional slides from the Data SnapShot: Session 1 here. This includes data slides with these titles: Bubble Chart: What to Look at First Industry Cluster Bubble Chart The Manufacturing Super-Cluster (if relevant) Manufacturing Sub-cluster Bubble Chart (if relevant). If you are only showing these to a smaller data team, just delete this slide.
Industry and occupation Top five occupations in 2015 Questions Questions: What are the education and skill requirements for these occupations? Do the emerging and star clusters align with the top occupations? What type salaries do these occupations typically provide? section 04 Source: EMSI Class of Worker 2016.4 (QCEW, non-QCEW, self-employed and extended proprietors) 29
Industry and occupation Science, Technology, Engineering & Math Job change in STEM occupations 108,663 97,839 11.1% 2,713 2,587 SIDC, IN -4.6% Rest of Indiana 2009 2015 Change Questions Questions: How do STEM jobs compare to the state? What has been the trend of STEM jobs over time? How important are STEM jobs to the region s Star and Emerging clusters? section 04 *Note: STEM and STEM-related occupation definitions from BLS (2010) Source: EMSI Class of Worker 2016.4 (QCEW, non-QCEW, self-employed and extended proprietors) 30
Workforce Data What are the region s unemployment trends? Are more people commuting into the region or commuting out? How do regional earnings compare to the state or nation?
Coaches, replace this chart with the one for your region. Cluster Analysis Dashboard Southern Indiana Development Commission: 2009 Southern Indiana Development Commission: 2009 - - 2015 2015 Location Quotient Location Quotient Shift Share Shift Share Jobs and Establishments Jobs and Establishments Earnings Earnings Concentration Concentration % % 2009 2009 LQ LQ 2015 2015 LQ LQ Percent Percent Change LQ Change LQ Job Job Ind Mix Ind Mix Effect Effect Nat Growth Nat Growth Effect Effect Expected Expected Change Change Competitive Competitive Effect Effect 2009 2009 Jobs Jobs 2015 2015 Jobs Jobs Earnings Earnings Per Worker Per Worker Earning Earning Per Per Estb Estb. . Industry Clusters Industry Clusters Change Change Jobs Jobs Establishments Establishments Earnings Earnings County County Firms Firms Jobs Jobs Change Change Advanced Materials 0.99 1.27 28% 637 (63) 189 126 510 2,159 2,796 29% 57 $191,758,617 $68,585 $3,349,495 0.357 0.072 0.150 Agribusiness, Food Processing And Technology 2.64 2.96 12% 733 (218) 513 296 437 5,871 6,604 12% 160 $249,062,567 $37,715 $1,554,213 0.271 0.213 0.230 Apparel And Textiles 0.56 0.47 (16%) (52) (12) 28 15 (68) 319 267 (16%) 14 $9,574,492 $35,900 $671,894 0.290 0.111 0.133 Arts, Entertainment, Recreation And Visitor Industries Biomedical/Biotechnical (Life Sciences) Business And Financial Services Chemicals Computer & Electronic Product Mfg. Defense And Security Education And Knowledge Creation Energy (Fossil And Renewable) Fabricated Metal Product Mfg. Forest And Wood Products Glass And Ceramics 0.43 0.37 (14%) (106) 32 108 140 (246) 1,235 1,130 (9%) 70 $15,613,839 $13,823 $223,854 0.266 0.129 0.141 0.94 0.82 (13%) (475) 31 459 491 (966) 5,255 4,780 (9%) 150 $168,307,745 $35,210 $1,123,925 0.280 0.096 0.209 0.56 1.67 0.17 0.58 0.39 1.46 1.18 1.49 4.12 0.49 1.72 0.15 0.47 0.38 1.30 1.21 1.76 3.91 (12%) 3% (11%) (18%) (3%) (11%) 3% 18% (5%) (365) 53 (18) (275) 31 (280) 67 269 (11) 91 (48) (13) (3) 27 191 21 (104) (4) 441 131 7 154 56 490 58 149 43 532 84 (6) 152 83 681 79 44 39 (896) (31) (12) (426) (51) (961) (12) 225 (50) 5,041 4,676 1,504 1,556 83 1,763 1,489 641 5,607 5,326 663 1,700 1,970 492 (7%) 3% (21%) (16%) 5% (5%) 10% 16% (2%) 348 48 2 50 25 259 30 118 4 $205,484,863 $43,943 $92,183,712 $6,407,657 $64,084,938 $17,536,759 $310,708,588 $58,333 $36,083,214 $72,714,059 $29,615,553 $590,050 0.209 0.073 0.080 $1,920,494 0.259 0.122 0.137 $3,203,829 0.501 0.500 0.501 $1,288,139 0.211 0.131 0.207 $708,556 0.233 0.139 0.117 $1,199,647 0.263 0.111 0.099 $1,202,774 0.498 0.218 0.177 $617,529 0.364 0.132 0.085 $6,968,365 0.572 0.280 0.579 $59,225 $98,407 $43,046 $26,106 65 672 729 $49,471 $36,919 $61,486 482 Information Technology And Telecommunications 0.40 0.29 (26%) (268) 8 101 109 (377) 1,152 884 (23%) 76 $50,598,994 $57,242 $670,185 0.249 0.201 0.196 Machinery Mfg. Mining 0.73 1.77 0.92 1.69 27% (4%) 110 34 4 42 29 30 33 72 78 (37) 332 347 443 381 33% 10% 17 22 $24,466,131 $26,054,486 $55,252 $68,317 $1,482,796 0.534 0.121 0.290 $1,211,837 0.409 0.206 0.226 $21,403,26 6 $516,299 0.227 0.122 0.157 $758,712 0.256 0.213 0.202 $5,028,770 0.558 0.174 0.467 Above Above Median Median Primary Metal Mfg. 3.90 4.66 20% 135 (12) 54 42 93 622 757 22% 4 $85,613,063 $113,130 0.772 0.375 0.544 Printing And Publishing Transportation And Logistics Transportation Equipment Mfg. 0.39 1.06 0.57 Above Above 1.2 1.2 0.43 1.02 1.91 Above Above 1.2 1.2 9% (4%) 232% 39 141 928 (26) 165 33 44 205 30 19 370 62 20 (228) 865 506 2,341 2,482 338 545 8% 6% 275% + + Change Change 36 149 11 Above Above Median Median $18,586,755 $112,858,442 $45,470 $56,573,665 Above Above Median Median $34,104 1,265 $44,708 Above Above Median Median KEY + Change + Change + Change + Change + Change + Change Top 10 Top 10 Top 10 Top 10 Average 1.24 1.34 0.10 63 7 158 165 -102 1,808 1,871 15% 79 $87,804,197 $51,733 $2,652,125 0.36 0.18 0.23 Median 0.94 1.02 -4% 34 4 101 83 -37 1,152 1,130 5% 48 $56,573,665 $45,470 $1,202,774 0.28 0.13 0.20
Honing in on Key Clusters Based on the assets of the region and current industrial trends Regional Competitiveness Export Value Resident s Values Key Industry Input Clusters Leakage What clusters should this region explore further? Number of Establishments Contribution by Counties
Reality Check and Next Steps Did the data reveal: Any new opportunities that should be considered? The need to eliminate previously considered opportunities? New partners that need to be included in the planning process.
Actions: Begin Writing the Plan Describe and summarize the Civic Engagement Forum process and results. Summarize key strengths and challenges based on the data Describe the selected clusters: Why were these clusters selected for further exploration? What are the strengths and challenges associated with the selected clusters? Which suggested opportunities are associated with each selected cluster?