Recap on Correlation Strength and Covariance

S1 :: Chapter 6
Correlation
www.drfrostmaths.com
Dr J Frost (jfrost@tiffin.kingston.sch.uk)


Last modified: 20
th
January 2016


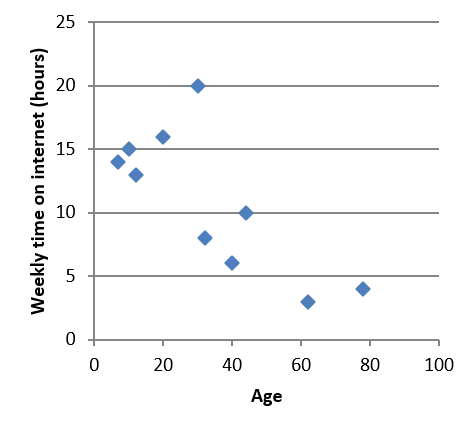
Type of correlation:
Weak positive correlation

?

?

strength


type

Weak negative correlation

?

?
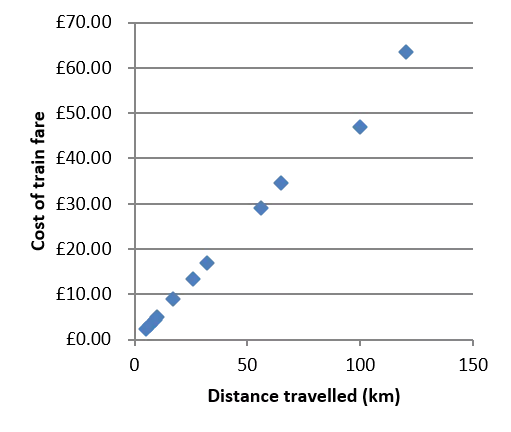
Strong positive correlation

?

?
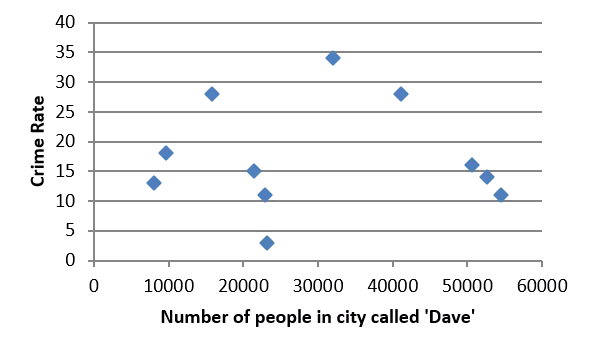
No correlation

?

Correlation gives the strength of the relationship (and
the type of relationship) between two variables.
Simplified formula
?
Formula based on
definition
?
Bro Exam Tip
: Given in
formula booklet, but
useful to memorise.
?
We understand variance as ‘
how much a variable varies
’.
We can extend variance to two variables.
We might be interested in
how one variable varies with another
.
?
(this won’t be tested in an exam but is
intended to provide background)
Comment on the covariance between the variables.
?
?
(this won’t be tested in an exam but is
intended to provide background)
Comment on the covariance between the variables.
?
?
(this won’t be tested in an exam but is
intended to provide background)
Simplified formula
?
?
?
We’ll interpret what
that means in a second.
Have an intelligent guess
based on the discussion
above.
?
We’ve seen the PMCC varies between -1 and 1.
means
Perfect positive correlation.
means
No correlation
means
Perfect negative correlation.
?
?
?
?
?
?
?
?
?
?
?
?
?
June 2013 Q1
?
?
?
?
?
?
?
?
?
?
?
Quite often the
values are given to
you in an exam.
“Interpret” vs “State”
In general in Statistics exams, the word ‘
interpret
’ means “explain
in context using non-statistical language”.
A bad answer (that may or may not be accepted):
“Strong negative correlation” (this is stating the correlation not
interpreting it)
A good answer:
“As the waiting time increases, the customer satisfaction tends
to decrease”.
?
?
Page 122 Exercise 6B
Q1, 4, 5, 7, 9
(on provided sheet)
Q1
?
?
?
?
?
?
?
?
We can now just find the PMCC of this new data set, and no further
adjustment is needed.
?
(on provided sheet)
Q2
?
?
?
(on provided sheet)
Q3
?
?
(on provided sheet)
Q4
?
?
?
(on provided sheet)
Q5
?
?
?
(on provided sheet)
Q6
?
?
?
(on provided sheet)
Q7
?
?
?
(on provided sheet)
Q8
?
?
?
?
?
(on provided sheet)
Q9
?
?
?
Often there’s a 3
rd
variable that explains two others, but the two
variables themselves are not connected.
Q1:
The number of cars on the road has increased, and the number of DVD
recorders bought has decreased. Is there a correlation between the two
variables?
Buying a car does not necessarily mean that you will not buy a DVD recorder,
so we cannot say there is a correlation between the two.
Q2:
Over the past 10 years the memory capacity of personal computers has
increased, and so has the average life expectancy of people in the western
world. Is there are correlation between these two variables?
The two are not connected, but both are due to scientific development over
time (i.e. a third variable!)
?
?
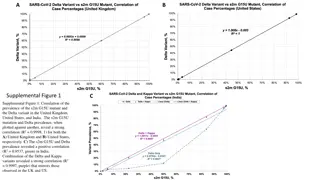
This content provides a recap on correlation strength, highlighting the relationship between variables based on their correlation value. It also touches on covariance, explaining how variables vary with each other. The examples and explanations help in understanding these statistical concepts better.

Download Presentation

Please find below an Image/Link to download the presentation.
The content on the website is provided AS IS for your information and personal use only. It may not be sold, licensed, or shared on other websites without obtaining consent from the author.If you encounter any issues during the download, it is possible that the publisher has removed the file from their server.
You are allowed to download the files provided on this website for personal or commercial use, subject to the condition that they are used lawfully. All files are the property of their respective owners.
The content on the website is provided AS IS for your information and personal use only. It may not be sold, licensed, or shared on other websites without obtaining consent from the author.
E N D
Presentation Transcript
S1 :: Chapter 6 Correlation www.drfrostmaths.com Dr J Frost (jfrost@tiffin.kingston.sch.uk) Last modified: 20th January 2016
Recap of correlation Correlation gives the strength of the relationship (and the type of relationship) between two variables. Weak negative correlation ? ? 25 100 Weekly time on internet (hours) 90 20 80 70 15 Maths Score 60 Type of correlation: Weak positive correlation ? ? 50 10 40 30 5 20 10 0 0 strength type 0 20 40 60 80 100 0 10 20 30 40 50 60 70 80 90 100 Age English Score 70.00 No correlation ? 60.00 40 50.00 35 Cost of train fare 30 40.00 Crime Rate 25 20 30.00 15 20.00 10 Strong positive correlation ? ? 5 10.00 0 0.00 0 10000 20000 30000 40000 50000 60000 0 50 100 150 Number of people in city called 'Dave' Distance travelled (km)
??? ??? represents the total squared distance from the mean. Formula based on definition ? ???= ? ?2 Bro Exam Tip: Given in formula booklet, but useful to memorise. ?2 ? Simplified formula ? = ?2 Recall that variance is defined as the average squared distance from the mean . We could therefore express ?2 in terms of ???: 2 = ?2 ? ? ? ??=??? ? ?
(this wont be tested in an exam but is intended to provide background) Covariance We understand variance as how much a variable varies . We can extend variance to two variables. We might be interested in how one variable varies with another. ? 70.00 60.00 50.00 Cost of train fare 40.00 30.00 We can say that as distance (say ?) increases, the cost (say ?) increases. Thus the covariance of ? and ? is positive. 20.00 10.00 0.00 0 20 40 60 80 100 120 140 Distance travelled (km)
(this wont be tested in an exam but is intended to provide background) Covariance Comment on the covariance between the variables. ? ? ? ? As ? increases, ?doesn t change very much. So the covariance is small (but positive) As ? increases, ?doesn t change very much. So the covariance is small (but positive) ? ?
(this wont be tested in an exam but is intended to provide background) Covariance Comment on the covariance between the variables. ? ? ? ? As ? varies, ?doesn t vary at all. So we say that variables are independent, and the covariance is 0.? As ? increases, ? decreases. So the covariance is negative. ?
??? Just as ??? gave a measure of how much a variable varies, ??? gives a measure of how two variables ? and ? vary with each other. ???= ? ? (? ?) ? ? ? Simplified formula ? = ?? Interesting things to note (but not examined): Just as ???????? ? =??? How could ????????(?) be expressed in terms of covariance? ???????? ? = ?????????? ?,? i.e. variance is the extent to which a variable varies with itself! ??? ? ? ?, ?????????? ?,? = ?
Product Moment Correlation Coefficient (PMCC) We saw that ??? gives a measure of how two variables vary with each other. That sounds like correlation! Wouldn t it be nice if we could somehow normalise it so we end up with just a number between -1 and 1 ??? ?????? Have an intelligent guess based on the discussion above. ? ? = We ll interpret what that means in a second. ? is known as the Product Moment Correlation Coefficient (PMCC).
Interpreting the PMCC We ve seen the PMCC varies between -1 and 1. means Perfect positive correlation. ? ? = 1 means No correlation ? ? = 0 means Perfect negative correlation. ? ? = 1
Interpreting the PMCC 25 Match the ? value to each scatter diagram. 100 Weekly time on internet (hours) 90 20 80 70 15 Maths Score ? = 0.8 60 50 10 40 30 5 20 ? = 0 10 0 0 0 20 40 60 80 100 0 10 20 30 40 50 60 70 80 90 100 Age English Score ? = 0.4 70.00 40 35 60.00 ? = 0.96 30 50.00 Crime Rate Cost of train fare 25 20 40.00 15 30.00 10 5 20.00 0 10.00 0 20000 40000 60000 Number of people in city called 'Dave' 0.00 0 50 100 150 Distance travelled (km)
Example Baby A B C D E F Head Circumference (?) 31.1 33.3 30.0 31.5 35.0 30.2 Gestation Period (?) 36 37 38 38 40 40 ?? = 7296.7 ? = 6 ? ? = 229 ? ? = 191.1 ?2= 6105.39 ?2= 8753 ? ? ? ? ?2 ? ?2 ? ? ? ? ???= ?2 ? = 18.855 ??? ?????? ? ? = = 0.196 ? ???= ?2 = 12.833 ? ???= ?? = 3.05
Lets do it on our calculators! Baby A B C D E F Head Circumference (?) 31.1 33.3 30.0 31.5 35.0 30.2 Gestation Period (?) 36 37 38 38 40 40 Put in Stats mode: MODE 2 Select 2 for ? + ?? (i.e. calculations to do with linear relationships) Insert the data into your table. Use the arrow keys and = to add the values. Once done, press the ?? button. This goes to normal calculation input. We want to insert ? into your calculation. Press ????? + 1, and choose 5 for REGRESSION. Select 3 for ?. ? is now in your calculation, so press =.
Test Your Understanding June 2013 Q1 ? ? ?
Further Practice Quite often the values are given to you in an exam. ? ? ? ? ? ? ? ?
Interpreting the PMCC Interpret vs State In general in Statistics exams, the word interpret means explain in context using non-statistical language . Bob wants to establish if there s a connection between waiting time (?) at the post office and customer satisfaction (?). He calculates ? as -0.81. Interpret this correlation coefficient. A bad answer (that may or may not be accepted): Strong negative correlation (this is stating the correlation not interpreting it) ? A good answer: As the waiting time increases, the customer satisfaction tends to decrease . ?
Exam Questions (on provided sheet) Q1 ? ? ?
(Before you go on to Q2) Effects of coding ??? ?????? We know that ???????? ? =??? ? and ? = Therefore, if all our data values ?get k times bigger in size and values ? become ? times bigger, what happens to (Recap) Variance of ?: ?2 times as big ???: ???: ???: ?: ? ? ? ? ? Bro Exam Note: For the purposes of the S1 exam, you just need to remember that: Coding affects ??? in the same way that the variance is affected. i.e. If the variance becomes 9 times larger, so does ???. PMCC is completely unaffected by (linear) coding. ?2 times as big ?2 times as big ?? times as big Unaffected!
Example ? 1020 1032 1028 1034 1023 1038 ? 320 335 345 355 360 380 ? =? 1020 ? =? 300 1 5 ? 0 12 8 14 3 18 ? 4 7 9 11 12 16 We can now just find the PMCC of this new data set, and no further adjustment is needed. ? = 0.655 ?
Exam Questions (on provided sheet) Q2 ? ? ?
Exam Questions (on provided sheet) Q3 ? ?
Exam Questions (on provided sheet) Q4 ? ? ?
Exam Questions (on provided sheet) Q5 ? ? ?
Exam Questions (on provided sheet) Q6 ? ? ?
Exam Questions (on provided sheet) Q7 ? ? ?
Exam Questions (on provided sheet) Q8 ? ? ? ? ?
Exam Questions (on provided sheet) Q9 ? ? ?
Limitations of correlation Often there s a 3rd variable that explains two others, but the two variables themselves are not connected. Q1: The number of cars on the road has increased, and the number of DVD recorders bought has decreased. Is there a correlation between the two variables? Buying a car does not necessarily mean that you will not buy a DVD recorder, so we cannot say there is a correlation between the two. ? Q2: Over the past 10 years the memory capacity of personal computers has increased, and so has the average life expectancy of people in the western world. Is there are correlation between these two variables? The two are not connected, but both are due to scientific development over time (i.e. a third variable!) ?


")


 Effects of coding")