Rates of Separation and Divorce Among Parents of Children with Neurodevelopmental Disorders
Research conducted in 2014 examines the impact of caring for a child with a neurodevelopmental disorder (NDD) on rates of separation and divorce among parents. Factors predicting separation/divorce are explored, highlighting the challenges faced by families of children with NDDs. The study emphasizes the need for support and understanding in such families to address the higher stress levels and potential strain on relationships.
Download Presentation

Please find below an Image/Link to download the presentation.
The content on the website is provided AS IS for your information and personal use only. It may not be sold, licensed, or shared on other websites without obtaining consent from the author.If you encounter any issues during the download, it is possible that the publisher has removed the file from their server.
You are allowed to download the files provided on this website for personal or commercial use, subject to the condition that they are used lawfully. All files are the property of their respective owners.
The content on the website is provided AS IS for your information and personal use only. It may not be sold, licensed, or shared on other websites without obtaining consent from the author.
E N D
Presentation Transcript
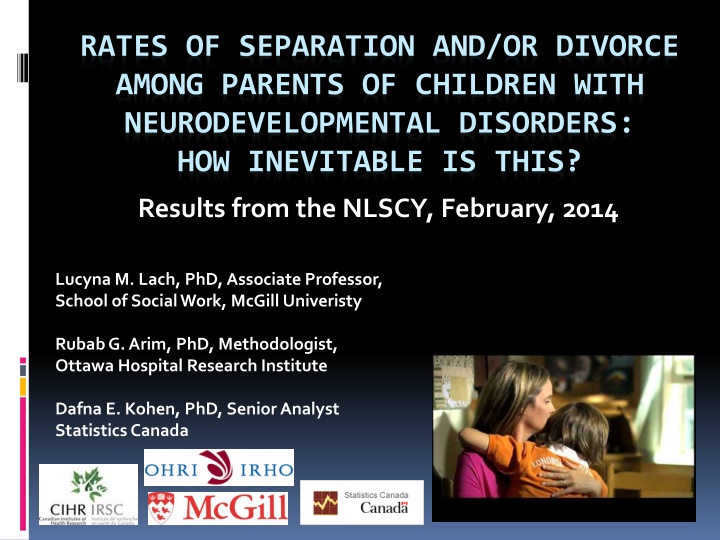
RATES OF SEPARATION AND/OR DIVORCE AMONG PARENTS OF CHILDREN WITH NEURODEVELOPMENTAL DISORDERS: HOW INEVITABLE IS THIS? Results from the NLSCY, February, 2014 Lucyna M. Lach, PhD, Associate Professor, School of Social Work, McGill Univeristy Rubab G. Arim, PhD, Methodologist, Ottawa Hospital Research Institute Dafna E. Kohen, PhD, Senior Analyst Statistics Canada
Learning Objectives As a result of attending this presentation, you will be able to answer the following questions: What is the impact that caring for a child with a neurodevelopmental disorder (NDD) has on rates of separation/divorce? What child, parent, and family factors predict separation/divorce among parents whose child has a neurodevelopmental disorder?
Why NDD? Issue of specificity: narrower than CHCD. NDD is an impairment of the growth and development of the brain or central nervous system associated with motor, cognitive, behavioural, and/or language function. e.g., ASD/PDD, cerebral palsy, epilepsy, learning disabilities, global developmental delay, and mental retardation Issue of complexity: NDD unfolds as the individual grows. NDD affects different aspects of function: ambulation, information processing (e.g., memory, expressive and receptive language), and self-regulation of emotion and behaviour In United States, up to 9.3% of children under age 18 have a NDD (CDC, 1995); comparable rate in Canada among 4-11 year olds Non-categorical approach recommended for decades (e.g., Pless & Pinkerton, 1975; Stein & Jessop, 1982)
Background Information Children with NDDs have higher rates of behavioural disorders than their peers without NDDs both concurrently (Howe et al., 1993; McDermott et al., 1995; 1996) and over time (Breslau & Marshall, 1985; Seltzer et al., 2005) Stress in families of children with NDDs is elevated (Rao & Biedel, 2009; Montes & Halterman, 2008) Higher levels of marital quality predict lower parenting stress and fewer depressive symptoms (Kersh et al., 2006)
Why study separation and/or divorce rates? Common belief that having a child with a NDD is a risk factor for separation and/or divorce "It can break a family apart as we've seen by the 80% divorce rate statistic (Autism Today website). Definitive statistics on the divorce rate of couples of children with disabilities are not available but there is general consensus that it is somewhat higher than in families with typical children. We do know that the divorce rate is terribly high for marriages in general; it is reported as approximately 50% for 1st marriages and close to 75% for 2ndmarriages (Marshak, 2007).
Why study separation and/or divorce rates? yeah because if, if we were both pessimistic people I don t think we would have lasted so long and that s one of the reasons the divorce rate is so high it s hard it s a daily struggle you know from the time we get up to the time we go to bed it s, it s like you always. even now .one eye and ear is where [son s name] is even though we re sitting here at the kitchen table talking I ve got a, you know like a, sixth sense of where he is and what he s doing . I have to Because he can not be left alone (father of 8 year old with moderate to severe autism, nonverbal)
Why study separation and/or divorce rates? because most parents. And I know, I can t really say that I know a lot of parents with autistic kids. And if they are, I can t say that I know a lot of fathers who have that I know the fathers. Cause most of the meetings I go to it s the women, you know, the women with the child and so forth. Unfortunately, statistically, it s staggering the amount of families that are broken up. Because it s too much. It s too much. Whether it s the mother, whether it s the father, they didn t see eye to eye. I can see where it can end up like that (father of 8 year old with moderate to severe autism, nonverbal)
Do parents of children with NDD have higher separation/divorce rates? - yes Mothers of children with disabilities are more likely to be separated and/or divorced than mothers of children without disabilities 14.3% vs. 11.4% (divorced) 8.2% vs. 5.4% (separated) (Witt et al., 2003) Parents of children with an ASD had a higher rate of divorce than the comparison group 23.5% vs. 13.8% (Hartley et al., 2010)
Do parents of children with NDD have higher separation/divorce rates? it depends Divorce rates among parents of children with Down Syndrome were lower than rates among parents of children with other birth anomalies and no identified disability (Urbano & Hodapp, 2007) Down s syndrome divorce rate: 7.6% Other birth anomalies: 11.2% No identified disability: 10.8%
Do parents of children with NDD have higher separation/divorce rates? no Children with ASD are no more likely to be in a traditional family than children without ASD Traditional = biological or adoptive married parents Non-traditional = other family structure such as separated/divorced, remarried, single, etc.) 64% vs. 65.2% (Freedman et al., 2010)
Previous Work Canadian National Longitudinal Survey of Children & Youth (NLSCY) Long-term study of child physical and social development Person most knowledgeable (PMK) about the child reports on child, self, spouse; child report 10+ Physical health, education, emotional, behavioural, social, family, neighbourhood variables First cohort (1994-5): 22,831 children Follow up data collected every 2 years until 2009 (last year of data collection)
Parents of children with NDD What is the impact of having a child with a complex health condition (NDD with and without behaviour problems) on CG s: Physical and psychological health? (i.e., chronic condition, activity limitation, general health and depressive symptoms) Psychosocial adjustment? (i.e., marital satisfaction, family functioning) Parenting? (i.e., positive interactions, consistent, ineffective)
Defining Our Groups Identifying the presence of a NDD: A checklist of chronic conditions diagnosed by a physician (epilepsy, cerebral palsy, mental handicap, learning disability) - OR - Health Utilities Index (speech, mobility, dexterity, cognition) Identifying the presence of a BP: PMK-reported child behaviour rating scale; items mostly derived from the Child Behaviour Checklist High scores on at least one of: hyperactivity-inattention (8 items), conduct disorder-physical aggression (6 items), indirect aggression (5 items)
Defining Our Groups NDD = Neurodevelopmental only BP = Behaviour problem only BOTH = NDD + BP Neither/None
Previous Findings In comparison to parents of children with no symptoms, parents of children with both sets of symptoms (NDD + BP) are: Most likely to report presence of a chronic condition or activity limitation Least likely to report being in excellent/good general health Parents of children with Both sets of symptoms (NDD + BP) have: Higher levels of depressive symptoms Higher levels of family distress Lach et al., 2009
Previous Findings In comparison to parents of children with no symptoms, parents of children with Both sets of symptoms (NDD + BP) have: Lower positive interaction scores e.g., How often do you and your child laugh together? Lower consistency scores e.g., When you give [your child] a command or order to do something, what proportion of the time do you make sure that [your child] does it? Higher ineffective parenting scores e.g., How often do you feel you are having problems managing [your child] in general? Arim et al., 2012; Garner et al., 2013
Research Questions: Do rates of separation and/or divorce differ among the 4 groups identified? What child, parent, and family characteristics predict separation and/or divorce?
Method N=14,226 (NLSCY Cycle 1; 4-11 years of age) Children whose health condition could not be identified due to missing data were excluded from the sample (n=261) The final N=13,965 Create 4 groups (NDD=815; BP=1322; Both=452; Neither=11376)
Other Measures Child socio-demographic and other health characteristics Parent socio-demographic characteristics Parent health characteristics (e.g., depression) Parenting and social support Family characteristics (e.g., family functioning) Parental separation / divorce
Data Analysis Descriptive statistics Group differences were examined with the reference group being NEITHER Logistic Regression (LR) analyses Five LR models that predicted the likelihood of parental separation / divorce.
Results Child Characteristics NDD BP BOTH NEITHER Age, M (SE) 8.15 (.11)* 7.42 (.09) 8.49 (.14)* 7.42 (.01) % female 61.06%* 50.82% 69.70%* 49.80% % only child 12.90% 8.80%* 18.62%* 12.13% % firstborn 35.74% 27.48%* 22.50%* 33.69% % later born 51.36% 63.72%* 58.88%* 54.18% Emo-dis/anx, M (SE) 3.76 (.16)* 4.49 (.15)* 6.14 (.27)* 2.13 (.04)
Results Parent Socio- Demographic Characteristics NDD BP BOTH NEITHER Age, M (SE) 35.31 (.26)* 34.88 (.26)* 34.85 (.32)* 35.87 (.10) Female, % 92.63% 90.56% 93.12% 90.05% High school, % 69.98%* 68.16%* 60.75%* 78.93% Immigrant, % 18.57% 14.30%* 14.66% 19.66%
Results Parent Characteristics NDD BP BOTH NEITHER Ex/Very good overall health, % 67.25%* 68.17%* 53.74%* 75.91% Depressive symptoms, M (SE), 0-36 5.91 (.41)* 7.04 (.39)* 8.92 (.51)* 4.25 (.10) Consistency in parenting, M (SE), 0-20 14.90 (.21) 13.75 (.18)* 13.34 (.30)* 15.08 (.06) Ineffective parenting, M (SE), 0-25 9.57 (.22)* 11.77 (.17)* 13.02 (.29)* 8.30 (.07) Social support, M (SE), 0-18 14.35 (.17) 14.14 (.15)* 13.83 (.20)* 14.54 (.06)
Results Family Characteristics NDD BP BOTH NEITHER No. of children <17, M (SE) 2.52 (.07) 2.53 (.06)* 2.31 (.07) 2.41 (.02) Low income, % 26.94%* 30.13%* 37.43%* 21.45% Moderate income, % 39.92% 36.37% 42.73%* 40.29% High income, % 33.15% 33.50%* 19.84%* 38.25% Family distress, M (SE), 0-36 8.66 (.31)* 9.45 (.28)* 10.50 (.39)* 7.67 (.11) Divorced/separated, % 35.83* 36.83* 44.51* 22.53
Predictors of Separation and/or Divorce Logistic Regression (Full Model) NDD (OR=1.71), BP (OR=1.60), BOTH (OR=1.61) Child characteristics Child emotional-disorder anxiety Parent characteristics Younger parent age Less than high school education Parent is not an immigrant Parent s depressive symptoms Consistency in parenting
Predictors of Separation and/or Divorce Logistic Regression (Full Model) Family characteristics Few children < 17 years of age Low income Family distress
Limitations & Strengths Parent-report Covers a period of 12 years Difficult to compare to published rates of separation and/or divorce due to different methods used in each study
Conclusions Caring for a child with NDD with or without behaviour problems is associated with higher risk for separation and/or divorce over a 12 year period It is important to consider other child, parent, and family characteristics to better understand the risk factors that are associated with children s experience of parental separation and/or divorce
CIHR Team in The Bio-psychosocial Context of Parenting Children with Neurodevelopmental Disorders in Canada Principal Investigators: Peter Rosenbaum; McMaster University Lucyna Lach, McGill University Dafna Kohen; Statistics Canada, Universite d Ottawa Team Leaders: Rachel Birnbaum; King s University College, UWO Rochelle Garner; Statistics Canada, Universite d Ottawa David Nicholas; University of Calgary Michael Saini; University of Toronto Team Members: Jamie Brehaut; Ottawa Hospital Research Institute, Universite d Ottawa Delphine Collin-Vezina; McGill University Michael MacKenzie; Columbia University Ted McNeill; Hospital For Sick Children Research Institute, University of Toronto Alison Niccols; McMaster University
Team - Collaborators Parents and Advocates: Frank Gavin; Co-Chair, Canadian Family Advisory Network Sue Robins; Member, Canadian Family Advisory Network Joanne Ganton; President, Calgary Cerebral Palsy Association Young Adults: Lindsay Yeo;Member, Canadian Family Advisory Network Institutional/Clinical Leaders: Elaine Orrbine;Canadian Association of Paediatric Health Centres Diane Calce;Marie Enfant Rehabilitation Centre of CHUM Ste. Justine Policy Makers Nancy Reynolds; President, Alberta Centre For Child, Family, and Community Research Linda Burnside; Executive Director, Disability Programs, Ministry of Family Services and Housing Government of Manitoba
