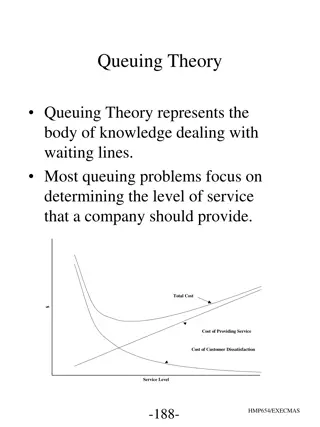
Queuing Theory and Its Applications in Operations Research
EASTERN MEDITERRANEAN UNIVERSITY
DEPARTMENT OF INDUSTRIAL ENGINEERING
IENG314 OPERATIONS RESEARCH II
Ilkin Jafarov
148692
Modeling the Service Process
IENG 314: Bonus Homework
The Kendall-Lee for Queuning
Systems
What is Queuing Theory?
Queueing theory is the mathematical study of waiting lines, or queues.
A queueing model is constructed so that queue lengths and waiting time
can be predicted. Queueing theory is generally considered a branch of
operations research because the results are often used when making
business decisions about the resources needed to provide a service.
Queuing Model
Queue Discipline
The queue discipline describes the method
used to determine the order in which
customers are served.
•
FCFS
•
LCFS
•
SIRO
Erlang Distribution
1
Modeling the Service Process
Example
Example
Lets
suppose
there are
three
automated cash register
in a shop, all of them are
busy, and a one customer is waiting in queue
.
And lets suppose before going
to cash register all customers scan their product and add them into theirs
online basket. In the cash register they only pay the total price of the basket.
The manager of the shop ask us
to find
probability that the
waiting customer
will be the last of the four customers to complete service in similar cases.
Lets assume the first customer was the first one that came to the cash register,
so by FCFS discipline he/she will be the first to complete service. Then
customer 4 will enter service. Customer 4’s service time has the same
distribution as the remaining service times of customers
2
and
3
. Thus,
customers 4, 2, and 3 will have the same chance of being the last customer to
complete service.
T
hat
means,
customer 4 has a
1/3
chance of being the last
customer to complete service.
Unfortunately, actual service times may not be consistent with the no-memory
property. For this reason, we often assume that s(t) is an Erlang distribution
with shape parameter k and rate parameter kµ.
The Kendall–Lee Notation for Queuing Systems
Where do we use the Kendall–Lee Notation?
1
The notation that we will discuss is used to
describe a queuing system in which all
arrivals wait in a single line until one of s
identical parallel servers is free.
2
The customer in server 1 is the next customer to
complete service, then (FCFS) the first customer in
line would enter server 1. The next customer in
line would enter service after the next service
completion, and so on.
Example
Characteristics of The Kendall–Lee Notation
1/2/3/4/5/6
or
A/S/
C
/K/N/D
A – Arrival process
M - Poisson distribution; random arrival process
D – Degenerate distribution; Deterministic or fixed arrival rate
G – General distribution
E – Erlang distribution
S – Service time distribution
M – Exponential service time
D – Degenerate distribution; Deterministic or fixed service
time
E – Erlang distribution
C – Number of servers
Can range from 1 to many
K – Capacity of the whole system, i.e., maximum number of
customers allowed in queue plus those being serviced.
By default taken as infinity
N – Size of the population from where customers are coming.
By default taken as infinity
D – Queue discipline, i.e., the order in which the customers in queue are
being served
FCFS – First come first serve; Default
LCFS – Last come first serve
SIRO – Service in random order
PS – Processor sharing
PNPN – Priority service
Examples of Simple Form of Kendall-Lee Notation
The simplest form of Kendall's notation consists of 3 letters:
a/b/c
Where,
a
represents the probability distribution of customers arrivals (
M,E,D,G
);
b
represents the probability distribution of service time (
M,E,D,G
);
c
is the number of servers;
For example, queuing system M/M/1 (simple system) means Poisson
distribution for arrival and Exponential distribution for service time and
one server. Queuing system M/M/2 has customers arrive according to
Poisson distribution with Exponential distribution for service time and the
system has two servers. Queuing system M/M/3 indicates that the
customers arrive according to Poisson distribution while the service time is
constant with 3 servers.
M/M/s
– Airline Ticket Counter
M/D/1
– Automated Car Wash
M/G/1
– Auto Repair Shop
Queuing theory is a mathematical study of waiting lines, or queues, commonly applied in operations research to predict queue lengths and waiting times. It helps businesses make decisions regarding resource allocation for efficient service provision. This field also encompasses queue discipline and Erlang distribution, offering valuable insights into service process modeling and customer flow optimization. Explore the role of queuing theory in optimizing service processes within various industries.

Uploaded on Jul 22, 2024 | 1 Views
Download Presentation

Please find below an Image/Link to download the presentation.
The content on the website is provided AS IS for your information and personal use only. It may not be sold, licensed, or shared on other websites without obtaining consent from the author.If you encounter any issues during the download, it is possible that the publisher has removed the file from their server.
You are allowed to download the files provided on this website for personal or commercial use, subject to the condition that they are used lawfully. All files are the property of their respective owners.
The content on the website is provided AS IS for your information and personal use only. It may not be sold, licensed, or shared on other websites without obtaining consent from the author.
E N D
Presentation Transcript
EASTERN MEDITERRANEAN UNIVERSITY EASTERN MEDITERRANEAN UNIVERSITY DEPARTMENT OF INDUSTRIAL ENGINEERING DEPARTMENT OF INDUSTRIAL ENGINEERING IENG314 OPERATIONS RESEARCH II IENG314 OPERATIONS RESEARCH II Ilkin Ilkin Jafarov Jafarov 148692 148692
Modeling the Service Process The Kendall-Lee for Queuning Systems IENG 314: Bonus Homework
What is Queuing Theory? What is Queuing Theory? Queuing Model Queueing theory is the mathematical study of waiting lines, or queues. A queueing model is constructed so that queue lengths and waiting time can be predicted. Queueing theory is generally considered a branch of operations research because the results are often used when making business decisions about the resources needed to provide a service.
Queue Discipline Queue Discipline The queue discipline describes the method used to determine the order in which customers are served. FCFS LCFS SIRO
Erlang Distribution Erlang Distribution 1 An Erlang distribution is a continuous random variable (T) whose density function f(t) is specified by two parameters: a rate parameter R and a shape parameter k . ? ? =?(??)? 1 ? ?? ? 1 !
Modeling the Service Process Modeling the Service Process We assume that the service times of different customers are independent random variables and that each customer s service time is governed by a random variable S having a density function s(t) and ? be the mean service time for a customer. Then: ?? ? ?? ? = 0 For example, =10 means that if customers were always present, the server could serve an average of 10 customers per hour, and the average service time of each customer would be hour. 1 10
Example Example Example Lets suppose there are three automated cash register in a shop, all of them are busy, and a one customer is waiting in queue. And lets suppose before going to cash register all customers scan their product and add them into theirs online basket. In the cash register they only pay the total price of the basket. The manager of the shop ask us to find probability that the waiting customer will be the last of the four customers to complete service in similar cases. Lets assume the first customer was the first one that came to the cash register, so by FCFS discipline he/she will be the first to complete service. Then customer 4 will enter service. Customer 4 s service time has the same distribution as the remaining service times of customers 2 and 3. Thus, customers 4, 2, and 3 will have the same chance of being the last customer to complete service. That means, customer 4 has a 1/3 chance of being the last customer to complete service. Unfortunately, actual service times may not be consistent with the no-memory property. For this reason, we often assume that s(t) is an Erlang distribution with shape parameter k and rate parameter k .
The Kendall The Kendall Lee Notation for Queuing Systems Lee Notation for Queuing Systems Where do we use the Kendall Lee Notation? 1 The notation that we will discuss is used to describe a queuing system in which all arrivals wait in a single line until one of s identical parallel servers is free. Example The customer in server 1 is the next customer to complete service, then (FCFS) the first customer in line would enter server 1. The next customer in line would enter service after the next service completion, and so on. 2
Characteristics of The Kendall Characteristics of The Kendall Lee Notation Lee Notation 1/2/3/4/5/6 or A/S/C/K/N/D A Arrival process M - Poisson distribution; random arrival process D Degenerate distribution; Deterministic or fixed arrival rate G General distribution E Erlang distribution D Queue discipline, i.e., the order in which the customers in queue are being served FCFS First come first serve; Default LCFS Last come first serve SIRO Service in random order PS Processor sharing PNPN Priority service S Service time distribution M Exponential service time D Degenerate distribution; Deterministic or fixed service time E Erlang distribution C Number of servers Can range from 1 to many K Capacity of the whole system, i.e., maximum number of customers allowed in queue plus those being serviced. By default taken as infinity N Size of the population from where customers are coming. By default taken as infinity
Examples of Simple Form of Kendall-Lee Notation The simplest form of Kendall's notation consists of 3 letters: a/b/c Where, a represents the probability distribution of customers arrivals (M,E,D,G); b represents the probability distribution of service time (M,E,D,G); c is the number of servers; M/M/s Airline Ticket Counter M/D/1 Automated Car Wash M/G/1 Auto Repair Shop For example, queuing system M/M/1 (simple system) means Poisson distribution for arrival and Exponential distribution for service time and one server. Queuing system M/M/2 has customers arrive according to Poisson distribution with Exponential distribution for service time and the system has two servers. Queuing system M/M/3 indicates that the customers arrive according to Poisson distribution while the service time is constant with 3 servers.