Public Opinion on Energy Policy: Competitive Markets vs. Energy Monopolies
Voters prefer competitive power markets for lower costs, renewable energy use, reliable service, and positive outcomes. Reliability and affordability are key concerns. Most support renewable resources but also non-renewable power plant maintenance. State-level data reveals specific opinions in Virginia and Illinois.
Download Presentation

Please find below an Image/Link to download the presentation.
The content on the website is provided AS IS for your information and personal use only. It may not be sold, licensed, or shared on other websites without obtaining consent from the author.If you encounter any issues during the download, it is possible that the publisher has removed the file from their server.
You are allowed to download the files provided on this website for personal or commercial use, subject to the condition that they are used lawfully. All files are the property of their respective owners.
The content on the website is provided AS IS for your information and personal use only. It may not be sold, licensed, or shared on other websites without obtaining consent from the author.
E N D
Presentation Transcript
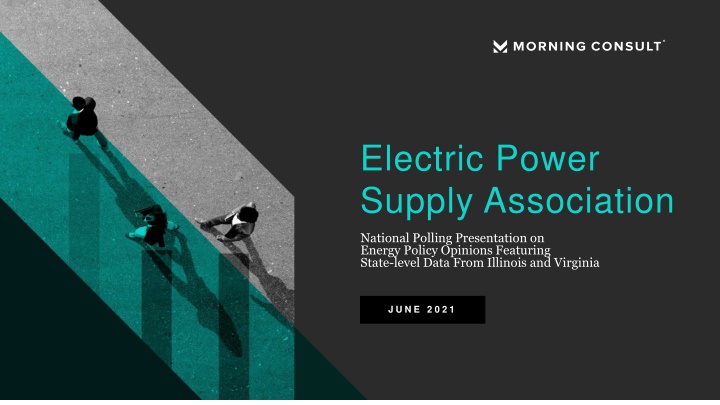
Electric Power Supply Association National Polling Presentation on Energy Policy Opinions Featuring State-level Data From Illinois and Virginia J U N E 2 0 2 1
KEY FINDINGS 1. Voters view competitive power markets as more effective than energy monopoly markets when it comes to lowering consumer costs, facilitating increased use of renewables, ensuring reliable service, and producing a range of other positive outcomes tested. 2. Reliability is the most important attribute driving Americans opinions on their own energy suppliers, followed closely by affordability. 3. While voters support bringing more renewable resources to the grid, four in five voters support maintaining non-renewable power plants to underpin the reliability of renewable energy sources. 4. State-specific findings: Virginia Four in five VA voters say the ability to choose who powers their homes is important to them. A similar majority support requiring the state s electricity providers to participate in a regional transmission system. Illinois Allegations of misconduct by energy lobbyists for the state s monopoly utility are of serious concern to voters. 2
CONTENTS COMPETITIVE POWER MARKETS ENERGY PROVIDER PERCEPTIONS ENERGY POLICY POSITIONS STATE-SPECIFIC QUESTIONS
COMPETITIVE POWER MARKETS Competitive power markets are seen as more effective than energy monopolies at accomplishing a range of positive outcomes for consumers, the environment, and the U.S. economy. Which model do you believe is more effective at accomplishing the following goals? Competitive electricity markets Don't know/No opinion Energy monopoly markets 62% 20% 18% Providing lower cost energy for customers Promoting new technologies and innovation in the 23% 58% 19% energy market Improving quality of service for customers in the 58% 21% 21% energy market Creating jobs and economic growth in the energy 19% 57% 24% sector Utilizing a diverse portfolio of energy sources 55% 26% 19% for generation Maximizing efficient use of resources in the 24% 22% 55% energy market Fostering energy independence and decreasing reliance on foreign sources of energy 53% 20% 27% Ensuring reliable service during extreme weather 50% 26% 24% events 30% 49% 21% Reducing harmful emissions 4
COMPETITIVE POWER MARKETS Voters have faith that a competitive power market would (or does) naturally encourage increased use of renewables by their state s electricity provider(s). Do you agree or disagree that that competition among electricity providers would help facilitate increased use of renewable energy in your state? 74% 42% 32% 11% 9% 16% 2% Strongly agree Somewhat agree Somewhat disagree Strongly disagree Don't know/No opinion 5
COMPETITIVE POWER MARKETS There appears to be consensus among voters across the political spectrum that market competition drives increased use of renewable energy resources by electricity providers. Do you agree or disagree that that competition among electricity providers would help facilitate increased use of renewable energy in your state? Net Agree Strongly agree Somewhat agree Don't know/No opinion Somewhat disagree Strongly disagree 32% 42% 16% 9% 8% 9% 8% Registered Voters 63% 39% 10% 41% Gender: Male 70% 25% 43% 22% Gender: Female 57% 38% 38% 10% 16% 41% 39% Age: 18-34 69% 6% Age: 35-44 69% 19% 18% 9% 10% 27% 28% 42% 43% Age: 45-64 58% Age: 65+ 59% 38% 42% 12% 7% PID: Dem (no lean) 72% 39% 27% 27% 21% 10% 9% PID: Ind (no lean) 53% 18% 44% PID: Rep (no lean) 60% 36% 15% 41% 7% Community: Urban 69% 30% 43% 16% 8% Community: Suburban 63% 25% 27% 44% 43% 17% 20% 11% Community: Rural 56% 9% Income: Under 50k 59% 34% 38% 42% 12% 10% Income: 50k-100k 64% 39% 15% 6% Income: 100k+ 69% 6
CONTENTS COMPETITIVE POWER MARKETS ENERGY PROVIDER PERCEPTIONS ENERGY POLICY POSITIONS STATE-SPECIFIC QUESTIONS
ENERGY PROVIDER PERCEPTIONS Reliability and affordability are king when it comes to voters priorities for the energy that powers their homes, with environmental friendliness ranking among the second-tier considerations. Thinking about the energy grid that powers your home, how important to you, if at all, are the following? Very important Somewhat important Not too important Not at all important 13% 84% Reliability 79% 18% Affordability 39% 9% 47% 5% Environmental friendliness 8% 45% 45% Technological innovation 42% 10% 45% Consumer choice 8
ENERGY PROVIDER PERCEPTIONS While most voters believe their electricity providers are appropriately prioritizing future energy reliability, only one-fifth would say that belief is deeply held. Do you believe your current electricity provider is appropriately prioritizing reliability as they plan for the future? 63% 42% 20% 21% 16% 15% 5% Strongly believe Strongly doubt Somewhat believe Somewhat doubt Don't know/No opinion 9
CONTENTS COMPETITIVE POWER MARKETS ENERGY PROVIDER PERCEPTIONS ENERGY POLICY POSITIONS STATE-SPECIFIC QUESTIONS
ENERGY POLICY POSITIONS Support is high for bringing more renewable energy resources onto respondents states electric grids more than six-times as many voters support these efforts as oppose them. Do you support or oppose your state's plans to bring more renewable resources onto the electric grid to become carbon-free? 75% 39% 36% 13% 7% 13% 6% Strongly support Somewhat support Somewhat oppose Strongly oppose Don't know/No opinion 11
ENERGY POLICY POSITIONS While support for bringing more renewables onto the grid is high across key demographic groups, Democrats (and more left-leaning groups, generally) express greater enthusiasm. Do you support or oppose your state's plans to bring more renewable resources onto the electric grid to become carbon-free? Net Strongly support Somewhat support Don't know/No opinion Somewhat oppose Strongly oppose Support 39% 36% 13% 6% 7% 5% 5% 6% 8% 7% 7% 7% 8% Registered Voters 62% 35% 45% 7% Gender: Male 66% 33% 36% 18% Gender: Female 56% 37% 45% 43% 11% Age: 18-34 75% 33% 14% Age: 35-44 67% 34% 37% 37% 14% 11% 7% 10% Age: 45-64 56% 35% Age: 65+ 55% 30% 57% 9% 8% PID: Dem (no lean) 83% 35% 35% 17% 5% PID: Ind (no lean) 57% 43% 13% 17% 15% 29% 11% 4% PID: Rep (no lean) 36% 52% 12% Community: Urban 74% 36% 38% 12% 6% 6% 4% 7% 6% 7% Community: Suburban 61% 12% 28% 38% 15% Community: Rural 48% 37% 37% 36% 38% 8% 15% 11% 10% Income: Under 50k 61% 7% 8% Income: 50k-100k 61% 31% 44% Income: 100k+ 61% 12
ENERGY POLICY POSITIONS Voters feel strongly that reliability needs to be maintained through the upkeep of existing non- renewable plants until renewable sources can operate with the same reliability. How important, if at all, is it for energy suppliers to continue to operate non-renewable power plants (coal, gas, or nuclear) to maintain a reliable supply of electricity until 100% renewable energy is a viable option? 81% 43% 38% 10% 9% 7% 3% Very important Somewhat important Not too important Not important at all Don't know/No opinion 13
ENERGY POLICY POSITIONS More than three-quarters of voters feel continuing to operate non-renewable energy plants to underpin the reliability of renewables is important, with males and Republicans feeling strongest. How important, if at all, is it for energy suppliers to continue to operate non-renewable power plants (coal, gas, or nuclear) to maintain a reliable supply of electricity until 100% renewable energy is a viable option? Total Important Very important Somewhat important Don't know/No opinion Not too important Not important at all 43% 38% 9% 7% 6% 7% 8% Registered Voters 81% 48% 37% 5% 4% Gender: Male 85% 39% 40% 43% 43% 38% 40% 13% 9% Gender: Female 77% Age: 18-34 80% 39% 36% 5% 11% Age: 35-44 82% 6% 7% 7% 8% 11% 4% Age: 45-64 79% 48% 37% 6% Age: 65+ 85% 40% 40% 8% 41% 37% PID: Dem (no lean) 81% 12% PID: Ind (no lean) 77% 50% 34% 9% 5% 7% 7% 6% 7% 7% 5% PID: Rep (no lean) 84% 37% 8% 45% Community: Urban 82% 40% 10% 10% 11% 8% 41% Community: Suburban 81% 34% 47% 4% Community: Rural 81% 36% 39% 42% 42% Income: Under 50k 78% Income: 50k-100k 81% 38% 47% 7% Income: 100k+ 85% 14
ENERGY POLICY POSITIONS Most voters do not think electricity bills should increase for ratepayers to support the operation of costlier power generation facilities. Do you agree or disagree that electricity rates for individual ratepayers should increase to cover the cost of operating more expensive generation facilities? 54% 35% 28% 26% 24% 12% 11% Strongly agree Somewhat agree Somewhat disagree Strongly disagree Don't know/No opinion 15
ENERGY POLICY POSITIONS Only among those that are younger than 45 and/or live in urban areas do more voters support increasing electricity bills to cover the cost of more expensive facilities than oppose doing so. Do you agree or disagree that electricity rates for individual ratepayers should increase to cover the cost of operating more expensive generation facilities? Net Agree Strongly agree Somewhat agree Don't know/No opinion Somewhat disagree Strongly disagree 24% 12% 26% 28% 25% 31% 11% 14% 7% Registered Voters -19% 29% 25% 7% Gender: Male -7% 19% 28% 15% Gender: Female -33% 33% 21% 17% 12% 20% 14% Age: 18-34 20% 13% 28% 33% 27% 13% 8% 26% 21% 22% Age: 35-44 1% 6% 36% 33% 17% 23% Age: 45-64 -41% Age: 65+ -40% 15% 10% 24% 25% PID: Dem (no lean) -8% 20% 16% 11% 25% 12% 28% 28% 29% 30% 7% 8% PID: Ind (no lean) -30% 23% PID: Rep (no lean) -27% 20% 12% 21% 22% Community: Urban 2% 23% 30% 25% 26% 29% 7% 8% 8% 11% Community: Suburban -29% 24% 21% 10% 14% 33% 31% Community: Rural -26% Income: Under 50k -28% 25% 10% 27% 27% 23% Income: 50k-100k -18% 16% 27% 8% 25% Income: 100k+ -5% 16
CONTENTS COMPETITIVE POWER MARKETS ENERGY PROVIDER PERCEPTIONS ENERGY POLICY POSITIONS STATE-SPECIFIC QUESTIONS
STATE-SPECIFIC QUESTIONS - ILLINOIS Illinois voters see allegations of corrupt lobbying by the state s energy monopoly as a legitimate concern, with two in five rating the information very concerning. The monopoly utility serving Illinois and its parent company have been investigated for corruption surrounding lobbying efforts to get greater financial assistance for nuclear plants through clean energy legislation. How concerning, if at all, do you find this information? 79% 42% 37% 11% 9% 9% 2% Very concerning Somewhat concerning Not too concerning Not concerning at all Don't know/No opinion 18
STATE-SPECIFIC QUESTIONS - ILLINOIS Senior and Republican Illinoisans express the greatest concerns about possible corrupt actions by the state s energy monopoly, though more than 70% express concern across all key groups. The monopoly utility serving Illinois and its parent company have been investigated for corruption surrounding lobbying efforts to get greater financial assistance for nuclear plants through clean energy legislation. How concerning, if at all, do you find this information? Total Very concerning Somewhat concerning Don't know/No opinion Not too concerning Not concerning at all Concerned 37% 35% 39% 42% 44% 40% 36% 37% 39% 9% 9% Registered Voters 79% 13% 5% Gender: Male 79% 13% 6% Gender: Female 79% 39% 40% 37% 6% 4% 16% 15% Age: 18-34 75% Age: 35-44 77% 15% 7% Age: 45-64 76% 33% 8% 4% 6% 54% Age: 65+ 87% 38% 46% 8% 16% PID: Dem (no lean) 84% 43% 47% 30% 7% 4% PID: Ind (no lean) 73% 29% 10% 10% 9% 10% 9% 8% 13% 12% PID: Rep (no lean) 76% 32% 50% 7% Community: Urban 82% 32% 32% 37% 36% 38% 46% 46% 42% 42% 42% 11% 9% 10% 11% 4% Community: Suburban 78% Community: Rural 78% Income: Under 50k 79% Income: 50k-100k 78% Income: 100k+ 80% 19
STATE-SPECIFIC QUESTIONS - VIRGINIA Four in five Virginia voters say it is very or somewhat important to be able to choose what company supplies power to their homes. How important, if at all, is your ability to choose what company that produces the energy that powers your home? 78% 40% 38% 15% 7% 11% 4% Very important Somewhat important Not too important Not important at all Don't know/No opinion 20
STATE-SPECIFIC QUESTIONS - VIRGINIA Large majorities of Virginia voters indicate they value the ability to choose who produces the energy they purchase. Seniors and suburbanites are less concerned with this than others. How important, if at all, is your ability to choose what company that produces the energy that powers your home? Net Very important Somewhat important Don't know/No opinion Not too important Not important at all Important 38% 40% 7% 11% 4% 5% 4% Registered Voters 63% 33% 45% 4% 14% Gender: Male 59% 35% 43% 10% 6% 13% 7% 18% 8% 14% Gender: Female 66% 38% 33% 37% 41% 45% 43% Age: 18-34 64% 7% Age: 35-44 69% 6% 7% 6% 5% Age: 45-64 67% 29% 45% Age: 65+ 50% 34% 46% 6% 10% PID: Dem (no lean) 65% 38% 36% 47% 12% 12% PID: Ind (no lean) 60% 33% 4% 12% 5% 4% 7% PID: Rep (no lean) 63% 38% 6% 51% Community: Urban 84% 34% 36% 8% 15% Community: Suburban 48% 40% 43% 10% 5% Community: Rural 71% 34% 40% 9% 12% 4% Income: Under 50k 58% 39% 45% 43% 5% 13% 8% Income: 50k-100k 73% 33% 6% 4% Income: 100k+ 57% 21
STATE-SPECIFIC QUESTIONS - VIRGINIA Only 7% of Virginia voters surveyed opposerequiring the state s electricity providers to participate in a regional transmission system aimed at promoting reliability and reasonable pricing. Four in five support this. Virginia's electric utilities are required by law to participate in a regional electricity transmission system aimed at promoting reliability and implementing price-control measures for consumers. Do you support or oppose this state requirement? 79% 41% 38% 7% 15% 5% 2% Strongly support Somewhat support Somewhat oppose Strongly oppose Don't know/No opinion 22
STATE-SPECIFIC QUESTIONS - VIRGINIA Support for requiring Virginia s electric utilities to be regulated under a regional electricity transmissions system transcends partisan lines, but support is notably high among Democrats. Virginia's electric utilities are required by law to participate in a regional electricity transmission system aimed at promoting reliability and implementing price-control measures for consumers. Do you support or oppose this state requirement? Net Strongly support Somewhat support Don't know/No opinion Somewhat oppose Strongly oppose Support 38% 15% 7% 21% 5% 41% Registered Voters 72% 42% 40% 8% Gender: Male 72% 34% 41% Gender: Female 72% 37% 44% 17% 10% Age: 18-34 79% 32% 37% 17% 4% Age: 35-44 55% 43% 37% 14% 11% 5% 5% 5% 4% Age: 45-64 73% 30% 53% Age: 65+ 76% 39% 9% 47% PID: Dem (no lean) 81% 34% 34% 21% 7% PID: Ind (no lean) 57% 30% 50% 17% PID: Rep (no lean) 76% 39% 39% 35% 33% 46% 10% 5% 4% 4% 8% Community: Urban 79% 39% 18% Community: Suburban 73% 40% 42% 13% 16% 8% Community: Rural 63% Income: Under 50k 66% 37% 45% 15% 10% 44% Income: 50k-100k 78% 39% Income: 100k+ 78% 23
