Protein Analysis Figures in Biochemistry Research
Explore various protein analysis figures including GAPDH, AKT, ATF4, tubulin, and more in biochemistry research. These figures provide insights into molecular interactions and signaling pathways.

Download Presentation

Please find below an Image/Link to download the presentation.
The content on the website is provided AS IS for your information and personal use only. It may not be sold, licensed, or shared on other websites without obtaining consent from the author. If you encounter any issues during the download, it is possible that the publisher has removed the file from their server.
You are allowed to download the files provided on this website for personal or commercial use, subject to the condition that they are used lawfully. All files are the property of their respective owners.
The content on the website is provided AS IS for your information and personal use only. It may not be sold, licensed, or shared on other websites without obtaining consent from the author.
E N D
Presentation Transcript
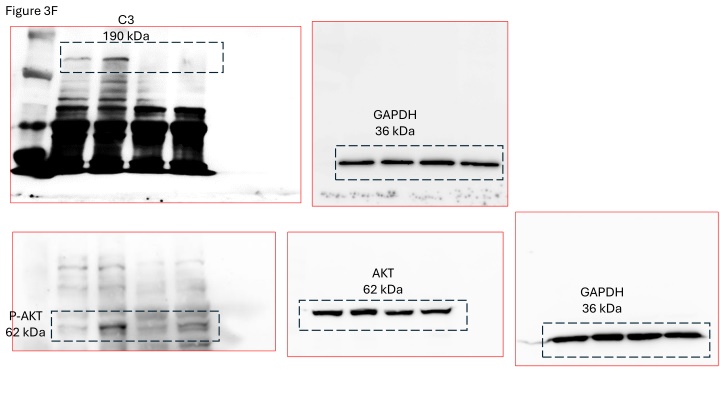
Figure 3F C3 190 kDa GAPDH 36 kDa AKT 62 kDa GAPDH 36 kDa P-AKT 62 kDa
Figure 3J 148 154 C3 C3 190 kDa 190 kDa 154 148 -tubulin 50kDa -tubulin 50kDa
Figure 6G C3 190 kDa -tubulin 50kDa -tubulin 50kDa C3 190 kDa
Figure 7D GAPDH 36 kDa C3 190 kDa ATF4 38.6 kDa elF2 38kDa p-elF2 38kDa GAPDH 36 kDa
Figure 7E GAPDH 36 kDa C3 190 kDa ATF4 38.6 kDa GAPDH 36 kDa p-elF2 38kDa elF2 38kDa
Figure 7G ATF4 38.6 kDa -tubulin 50kDa C3 190 kDa
Supp Figure 2D GAPDH 36 kDa AKT 62 kDa P-AKT 62 kDa
Supp Figure 4E C3 190 kDa -tubulin 50kDa