Proportional Relationships in Mathematics
Explore the concept of proportionality using graphs, tables, and ratios. Learn how to determine if a relationship is proportional by analyzing ratios y:x and the constant of proportionality. Practice exercises and examples provided for better comprehension.

Download Presentation

Please find below an Image/Link to download the presentation.
The content on the website is provided AS IS for your information and personal use only. It may not be sold, licensed, or shared on other websites without obtaining consent from the author.If you encounter any issues during the download, it is possible that the publisher has removed the file from their server.
You are allowed to download the files provided on this website for personal or commercial use, subject to the condition that they are used lawfully. All files are the property of their respective owners.
The content on the website is provided AS IS for your information and personal use only. It may not be sold, licensed, or shared on other websites without obtaining consent from the author.
E N D
Presentation Transcript
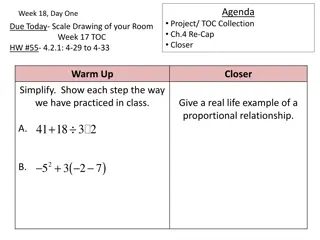
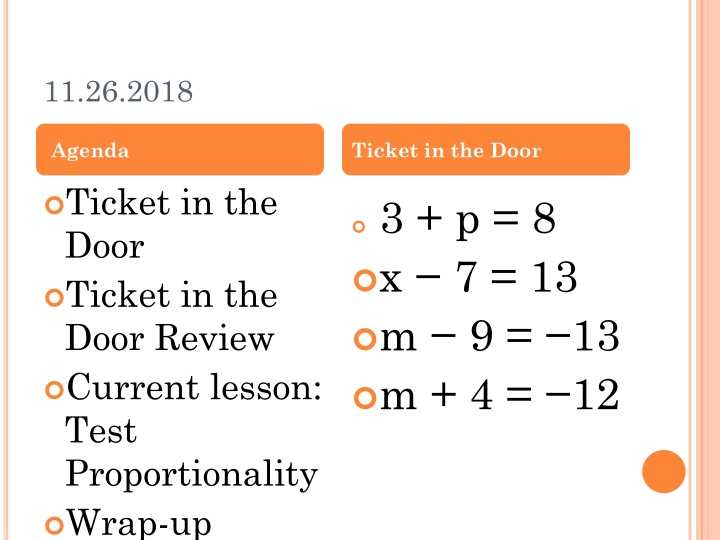
11.26.2018 Agenda Ticket in the Door Ticket in the Door Ticket in the Door Review Current lesson: Test Proportionality Wrap-up 3 + p = 8 x 7 = 13 m 9 = 13 m + 4 = 12
PROPORTIONALITY USING GRAPHS AND TABLES Exercise for Practices
PROPORTIONALITY USING GRAPHS AND TABLES INTRODUCTION https://www.youtube.com/watch?v=HwJPkXOboB k https://www.youtube.com/watch?v=USmit5zUGas https://www.youtube.com/watch?v=0JCoSeFKW_ Y&list=PL7df- zRnuvQWxyb2j60R3DjbV7xExH1Hy
FORMAT YOUR PAPER FOR CORNELL NOTES Topic/E.Q. Cornell Note Example Topic: Understanding Proportional Relationships E.Q. How do I determine when a proportional relationship exist?
PROPORTIONAL RELATIONSHIPS We can use our knowledge of ratios and proportions to determine if there is a proportional relationship between different elements. Relationships are usually represented using a graph or a table. We can use the graphs and tables to test the proportionality.
USING A TABLE In order to tell from a table if there is a proportional relationship or not, you can check to see if the ratio y : x is the same. The ratio y : x is also known as the constant of proportionality. You must reduce the ratios to accurately compare!
EX .Tell if the following tables represent a proportional relationships. This is a proportional relationship because the y: x ratios are all equal! x y y:x =y/x 10/5 = 2/1 16/8 = 2/1 20/10 = 2/1 28/14 = 2/1 42/21 = 2/1 5 10 8 16 The constant of proportionality is 2/1 (or 2) 10 20 14 28 21 42
EX .Tell if the following tables represent a proportional relationships. This is NOT a proportional relationship because the y: x ratios are not all equal! x y y:x =y/x 9/6 = 3/2 15/10 = 3/2 20/4 = 5/1 21/14 = 3/2 42/21 = 2/1 6 9 10 15 4 20 14 21 22 44
PRACTICE Are the following tabled representing proportional relationships? X Y X Y 4 6 1 4 6 9 2 8 10 15 3 9
QUICK REVIEWOF GRAPHING Ordered Pair - A pair of numbers (x , y)used to locate a point on a coordinate plane. Also called a point. Using the table below, create a list of ordered pairs. X Y (1,4) , (3,8), (2,6), (8,10) 1 4 3 8 2 6 8 10
QUICK REVIEWOF GRAPHING When we plot points on the grid (coordinate plane), we start at the origin then count : right or left on the x-axis and then up or down on the y-axis. 1. 1. y-axis x-axis Origin (0,0)
QUICK REVIEWOF GRAPHING Plot the following points (write the ordered pairs on the grid) y 0 1 2 3 4 5 6 7 8 (1,4) and (2,8) (2,8) (1,4) x 0 1 2 3 4 5 6 7 8
USINGA GRAPH We can test for proportionality on a graph by looking for various properties. A proportional graph will always go through the origin (0,0) A proportional graph will be a straight line. If you list points (ordered pairs) from a graph, you can create ratios and see if they are constant (equal). 1. 2. 3.
In order to tell if a graph is proportional the line must go through the origin and be a straight line. Straight line ? Yes Passes through (0,0)? Yes This is a proportional relationship!
In order to tell if a graph is proportional the line must go through the origin and be a straight line. Straight line ? Yes Passes through (0,0)? No This is NOT a proportional relationship!
In order to tell if a set of ordered pairs is proportional, graph them or look at the ratio of y to x. Tell if the following set of ordered pairs represents a proportional relationship. ( ) ( ) ( 8, 4 , 10, 5 , 5, 2.5 , 12, 6 ) ( ) (x, y) ordered pairs are used to make ratios y: x = y/x This is a proportional relationship because the ratios are constant 4/8 = 1/2 5/10 = 1/2 2.5/5 = 1/2 6/12 = 1/2
USINGAN EQUATION To determine if the following equations show a proportional relationship, put a zero in for x and solve for y. if y is zero then it is a proportional relationship because it goes through the origin. y = 10x y = 3x + 1 y = 3(0) + 1 y = 10(0) y= 0 + 1 y= 0 y= 1 Not Proportional Proportional
GRAPHING PROPORTIONAL RELATIONSHIPS 1. Given a table Create a list of ordered pairs Plot the points on the grid Connect using a ruler Label axis 2. Given an equation Create a table Create a list of ordered pairs Plot the points Connect using a ruler Label axis
GRAPHINGGIVENATABLE Hours X 0 Miles Y 0 (2,6) 1 3 Miles (1,3) 2 6 Ordered pairs: (0,0), (1,3), (2,6) Hours (0,0)
GRAPHING GIVENAN EQUATION y = 2x 1. Create a table by substituting value into x and solving for y. (need three points) X y=2x Y 0 y= 2(0)= 0 0 1 y= 2(1) = 2 2 2 y=2(2) = 4 4 2. Ordered Pairs (0,0), (1,2), (2,4)
GRAPHING GIVENAN EQUATION 3. Plot the points on the grid. (0,0), (1,2), (2,4) 4. Connect the points
REFERENCE http://sunvalleycharterschool.com/teacher_blog/fil e/8th%20G%20PPT%20- %20Proportionality_Using_Graphs_and_Tables.p pt.