Poverty Statistics and Indicators in Pakistan
The statistics presented in this report shed light on poverty, labor force participation, unemployment rates, and key indicators in Pakistan. It discusses the struggles faced by individuals and households due to deprivation, emphasizing the importance of basic human assets. The report also outlines methodologies used for estimating poverty and the significance of consumption data in this process.
Download Presentation

Please find below an Image/Link to download the presentation.
The content on the website is provided AS IS for your information and personal use only. It may not be sold, licensed, or shared on other websites without obtaining consent from the author.If you encounter any issues during the download, it is possible that the publisher has removed the file from their server.
You are allowed to download the files provided on this website for personal or commercial use, subject to the condition that they are used lawfully. All files are the property of their respective owners.
The content on the website is provided AS IS for your information and personal use only. It may not be sold, licensed, or shared on other websites without obtaining consent from the author.
E N D
Presentation Transcript
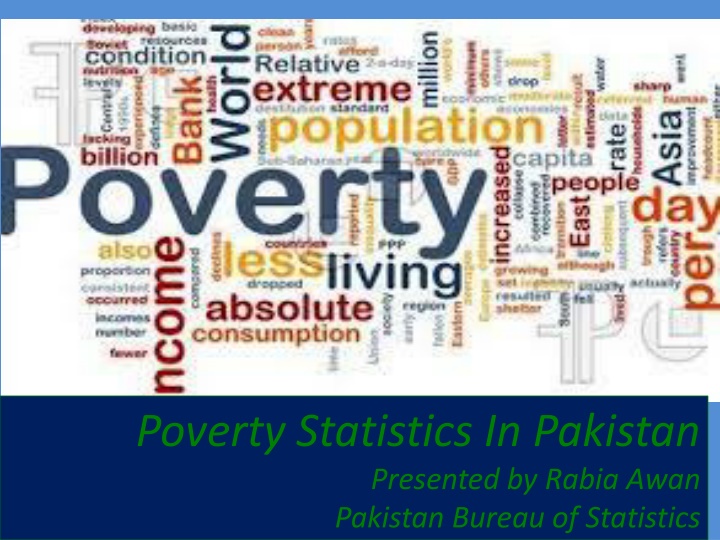
Poverty Statistics In Pakistan Presented by Rabia Awan Pakistan Bureau of Statistics
Main Indicators of Pakistan Main Indicators Total Male Female Labour Force Participation rates 32.9 49.3 15.6 Unemployment rates 6.0 5.1 8.9 Employment by formal sectors 26.4 26.2 28.3 Employment by informal sectors 73.6 73.8 71.7 Sex ratio 106 Life Expectancy at Birth 64 67 Literacy rates 60 71 48 Net Enrolment Rate (Primary level) 57 61 54 Source: PSLM Survey 2012-13, LFS Survey 2012-13 Expert Group Meeting on Enhancing National Capacities of OIC member Countries in Poverty Statistics 7-8th August Ankara, Turkey 2 9/24/2024
Main Indicators of Pakistan Main Indicators Total Urban Rural Total Fertility Rate 3.8 3.2 4.2 Contraceptive Prevalence rate 35 45 31 Prenatal care( from Skilled Birth Attendant) 73 88 67 Births delivered in Health Facility 48 68 40 Infant Mortality rate(deaths per 1000 live births) 74 63 88 Under five mortality rate 89 74 106 Population with access to Improved Drinking water 59 83 48 Population with access to sanitation(Flush toilet) 71 97 57 Source: PSLM Survey 2012-13, PDHS Survey 2012-13 Expert Group Meeting on Enhancing National Capacities of OIC member Countries in Poverty Statistics 7- 8th August Ankara, Turkey 3 9/24/2024
TOWARDS DEFINING POVERTY Poverty is considered as synonymous to deprivation Poverty encompasses many attributes to the disadvantage of individuals/households in their struggle of survival Poverty is strongly related to the absence of basic human and physical assets, especially health, education and land Poverty is often defined as the inability to afford consumption expenditure necessary to meet nutritional requirements Expert Group Meeting on Enhancing National Capacities of OIC member Countries in Poverty Statistics 7- 8th August Ankara, Turkey 9/24/2024 4
TOWARDS QUANTIFYING POVERTY Different methodologies have been used since 1970 to estimate poverty. Each methodology has its own advantages as well as limitations Planning commission estimates poverty in terms of threshold caloric intake requirement of 2350 calories per person per day. Poverty estimates are based on Consumption data provided by Household Integrated Economic Survey (HIES) HIES survey has been undertaken with some breaks since 1963 HIES Survey is part of biennial cycle of Pakistan Social & Living Standards Measurement Survey(PSLM) at National/Provincial level and District level Expert Group Meeting on Enhancing National Capacities of OIC member Countries in Poverty Statistics 7-8th August Ankara, Turkey 5 9/24/2024
Types of Poverty Lines Subjective poverty line Based on person s perception of poverty Relative poverty line Where households are in relation to some increasing function of the average standard of living in the country Absolute poverty line Whether or not HHs or individuals command a fixed standard of living Expert Group Meeting on Enhancing National Capacities of OIC member Countries in Poverty Statistics 7-8th August Ankara, Turkey 9/24/2024 6
World Bank Absolute Poverty Lines Purpose: to compare poverty rates across countries and over time and to assess progress in poverty reduction US $1 per person per day (1993) Individual is poor if income is less than $1 per day Current global estimate: 1,200 million people are poor US $2 per person per day (1993) Individual is poor if income is less than $2 per day Current global estimate: over 2 billion people are poor Expert Group Meeting on Enhancing National Capacities of OIC member Countries in Poverty Statistics 7-8th August Ankara, Turkey 9/24/2024 7
Main characteristics of the poor Poverty is strongly related to the absence of basic human and physical assets, especially health, education and land Poor have larger household size Poor have a higher dependency ratio The poor household heads are mostly employed in elementary job e.g. agriculture, construction, labours etc. Expert Group Meeting on Enhancing National Capacities of OIC member Countries in Poverty Statistics 7- 8th August Ankara, Turkey 9/24/2024 8
METHEODOLOGY OF POVERTY ASSESMENT Six major steps constitute Poverty assessment in Pakistan 1. Choice of welfare Indicator 2. Consumption aggregate 3. Adjustment of Consumption 4. Price Adjustment 5. Poverty line 6. Choice of aggregator Expert Group Meeting on Enhancing National Capacities of OIC member Countries in Poverty Statistics 7-8th August Ankara, Turkey 9/24/2024 9
METHEODOLOGY OF POVERTY ASSESMENT 1. Choice of welfare Indicator:- Consumption expenditure has been selected to use as welfare indicator The consumption data is based on HIES Survey of PBS 2. Consumption aggregate:- It composes of both actual and imputed expenditure , including actual purchases ,self produced and consumed items Includes food items, fuel and utilities, housing (rent, imputed rent and minor repair),frequent nonfood expenses and other non food expenses Excludes expenses on taxes, fines and expenses on marriage or funeral and durable items Expert Group Meeting on Enhancing National Capacities of OIC member Countries in Poverty Statistics 7-8th August Ankara, Turkey 9/24/2024 10
METHEODOLOGY OF POVERTY ASSESMENT 3.Adjustment of Consumption Household consumption is converted into per month per adult consumption expenditure Households are ranked on equivalent scales by allocating 0.8 weight to individuals younger than 18 years and 1 to all other individuals 4. Price Adjustment The per adult equivalent consumption expenditure is adjusted for regional price differences using Paasches Price index at Primary sampling Unit(PSU) This is done to convert welfare indicator in real values as household face different prices during the year of survey Expert Group Meeting on Enhancing National Capacities of OIC member Countries in Poverty Statistics 7-8th August Ankara, Turkey 11 9/24/2024
METHEODOLOGY OF POVERTY ASSESMENT 5.Poverty Line Calorie based approach is used for estimation of Poverty line Calorie requirement: The poverty lines reflect the consumption expenditure consistent with caloric requirement Food quantities consumed by households are converted into caloric intakes Poverty Line is estimated by regressing consumption expenditure against caloric intakes Calories = a + b (Consumption Exp.) Planning Commission has notified poverty line at 673.54 (per capita food and non-food expenditure per month) on 2350 calories on the basis of HIES 1998-99 Poverty line for other years are adjusted for inflation between the two household on the basis of Consumer Price Index(CPI) calculated by PBS Expert Group Meeting on Enhancing National Capacities of OIC member Countries in Poverty Statistics 7-8th August Ankara, Turkey 12 9/24/2024
Poverty line Year Poverty Line (Rs/months) Inflation 1998-99 673 - 2000-01 723 7.4 2004-05 879 21.5 2005-06 944 7.3 2007-08 1142 20.9 2010-11 1745 52.0
MEASURES OF POVERTY Head count ratio , poverty gap and severity of poverty commonly known as Foster, Greer and Thorbecke measures are used for estimation of poverty Head count ratio is the mostly used measure and is defined as the proportion of population below the poverty line Poverty index(Head Count ratio) by region Overall Urban Rural PIHS 1998-99 31.1 21.4 35.1 PIHS 2000-01 34.0 23.0 39.0 PSLM 2004-05 24.0 15.0 28.0 PSLM 2005-06 23.0 14.0 27.0 PSLM 2007-08 17.2 10.0 20.6 PSLM 2010-11 12.4 7.1 15.1 Expert Group Meeting on Enhancing National Capacities of OIC member Countries in Poverty Statistics 7-8th August Ankara, Turkey
Trends in Poverty 40 39 35 35.1 34 31.1 30 28 27 25 24 23 23 21.4 Overall 20.6 20 17.2 Urban 15 15.1 15 14 Rural 12.4 10 10 7.1 5 0 PIHS 1998-99 PIHS 2000-01 PSLM 2004-05 PSLM 2005-06 PSLM 2007-08 PSLM 2010-11 Expert Group Meeting on Enhancing National Capacities of OIC member Countries in Poverty Statistics 7-8th August Ankara, Turkey 9/24/2024 15
Gini-coefficient All Urban Rural 2000-01 0.2752 0.3222 0.2371 2004-05 0.2976 0.3388 0.2519 2005-06 0.3018 0.349 0.2462 2007-08 0.2897 0.3245 0.2529 2010-11 0.2752 0.3124 0.2371 Expert Group Meeting on Enhancing National Capacities of OIC member Countries in Poverty Statistics 7-8th August Ankara, Turkey 9/24/2024 16
Trends in Consumption based Gini coefficient 0.36 0.349 0.34 0.3388 0.3245 0.3222 0.32 0.3124 0.3018 0.3 0.2976 0.2897 All 0.28 0.2752 0.2752 Urban 0.26 Rural 0.2529 0.2519 0.2462 0.24 0.2371 0.2371 0.22 0.2 2000-01 2004-05 2005-06 2007-08 2010-11 Expert Group Meeting on Enhancing National Capacities of OIC member Countries in Poverty Statistics 7-8th August Ankara, Turkey 17 9/24/2024
Sample size (number of households) Survey Overall Urban Rural PIHS 2000-01 14705 5536 9169 PSLM 2004-05 14706 5808 8898 PSLM 2005-06 15453 62.40 9213 PSLM 2007-08 15512 6255 9257 PSLM 2010-11 16341 6589 9752 Expert Group Meeting on Enhancing National Capacities of OIC member Countries in Poverty Statistics 7-8th August Ankara, Turkey 9/24/2024 18
Number of consumption items Survey Food items Non-food items Total items PIHS 2000-01 89 107 196 PSLM 2004-05 89 107 196 PSLM 2005-06 69 99 168 PSLM 2007-08 69 99 168 PSLM 2010-11 69 99 168 Some of the similar items were merged in 2005-06, no item is deleted Expert Group Meeting on Enhancing National Capacities of OIC member Countries in Poverty Statistics 7-8th August Ankara, Turkey 9/24/2024 19
Households size by region Year Urban Rural Overall PIHS 2001-02 6.87 7.00 6.96 PSLM 2004-05 6.63 6.8 6.75 PSLM 2005-06 6.65 6.93 6.83 PSLM 2007-08 6.31 6.72 6.58 PSLM 2010-11 6.19 6.49 6.38
Per equivalent adult monthly consumption expenditure at the prices of 2001 Quintile PSLM 2010-11 Urban Rural Total Poorest 20% 679 674 675 Second 911 901 904 Third 1118 1111 1113 Fourth 1418 1406 1411 Richest 20% 2789 2281 2543 All 1604 1181 1322 Expert Group Meeting on Enhancing National Capacities of OIC member Countries in Poverty Statistics 7-8th August Ankara, Turkey 9/24/2024 21
Per equivalent adult monthly consumption expenditure at the prices of 2001 Quintile PIHS 2000-01 PSLM 2004-05 PSLM 2005-06 PSLM 2007-08 PSLM 2010-11 Growth (10-11, 5-6) Growth (10-11, 7-8) Mean Mean Mean Mean Mean Poorest 20% 508 555 580 632 675 16.4 6.8 Second 690 775 789 851 904 14.6 6.2 Third 845 961 978 1048 1113 13.8 6.2 Fourth 1070 1238 1255 1342 1411 12.4 5.1 Richest 20% 1908 2327 2435 2487 2543 4.4 2.2 All 1004 1171 1207 1272 1322 9.5 3.9
Percentage distribution of monthly consumption expenditure commodity groups at prices of 2001 by region Commodity group PSLM 2010-11 Urban Rural Total Food 41.9 55.3 49.9 Fuel & lighting 7.3 8.1 7.8 Personal care 3.6 3.9 3.8 Transport 6.2 5.3 5.6 Clothing 4.0 4.6 4.3 Medical 2.3 3.3 2.9 Education 4.7 2.4 3.4 House rent 21.0 8.8 13.7 Others 11.3 11.6 11.5 Total 100.0 100.0 100.0 Expert Group Meeting on Enhancing National Capacities of OIC member Countries in Poverty Statistics 7-8th August Ankara, Turkey 9/24/2024 23
Percentage distribution of monthly consumption expenditure commodity groups at prices of 2001 Commodity groups PIHS 2000-01 PSLM 2004-05 PSLM 2005-06 PSLM 2007-08 PSLM 2010-11 Food 49.5 49.1 48.1 43.5 49.9 Fuel & lighting 8.1 8.0 8.8 7.7 7.8 Personal care 3.9 3.8 3.9 3.5 3.8 Transport 3.7 4.9 5.2 6.5 5.6 Clothing 5.7 5.0 5.0 4.2 4.3 Medical 4.5 4.0 4.5 3.7 2.9 Education 3.5 3.0 2.6 3.4 3.4 House rent 12.0 11.9 12.2 17.0 13.7 Others 9.0 10.3 9.7 14.2 11.5 Total 100.0 100.0 100.0 100.0 100.0
Per capita monthly consumption (quantity) of major food items Commodity PIHS 2000-01 PSLM 2004-05 PSLM 2005-06 PSLM 2007-08 PSLM 2010-11 Unit QTY QTY QTY QTY QTY Wheat Kg 8.94 8.20 8.18 7.75 7.98 Rice Kg 1.17 1.03 1.03 0.90 1.00 Pulses Kg 0.35 0.44 0.37 0.36 0.40 Vegetable Ghee g 0.64 0.67 0.66 0.69 0.74 Cooking oil Itr 0.09 0.12 0.15 0.16 0.17 Tea Grams 56.23 72.21 71.73 67.71 70.05 Milk kg 5.79 6.68 6.45 6.90 6.60 Mutton kg 0.10 0.07 0.08 0.06 0.06 Beef kg 0.30 0.33 0.21 0.22 0.23 Chicken kg 0.14 0.23 0.23 0.27 0.28 Fish kg 0.00 0.05 0.05 0.06 0.05 Fruit kg 0.53 0.43 0.63 0.57 0.58 Vegetable kg 3.88 4.20 3.83 3.89 4.16 Sugar kg 1.26 1.31 1.33 1.40 1.38 Gur Kg 0.15 0.18 0.12 0.08 0.08
Issues/Challenges related to Poverty Statistics Poverty Statistics are highly debatable in Pakistan Uni dimensional Poverty figures are not released regularly Different organizations are releasing numbers using different methodology Poverty figures are usually released at National level with urban/Rural breakdown Efforts are also being made to calculate Multi- dimensional poverty with the help of Oxford Poverty & Human Development Initiative(OPHI) Expert Group Meeting on Enhancing National Capacities of OIC member Countries in Poverty Statistics 7-8th August Ankara, Turkey 26 9/24/2024
Initiatives to Combat Poverty Benazir Income Support Program (BISP). This program would serve as a platform to provide cash transfers to vulnerable identified on the basis of a poverty scorecard. Imparting training to one member of each vulnerable family. BISP cover 3.4 million families or 22.75 million people. Waseela-e-Haq Scheme:- Under this scheme 2.2 million families have been divided into 731 units. Every month 731 Female head of households will be given Rs.0.300 million in lump sum to start their own business. First draw was made on 15th September, 2009. Pakistan Bait-ul-Mal Child Support Program Health Insurance for the Poor and the vulnerable Social Mobilization Community Investment Fund (CIF) Expert Group Meeting on Enhancing National Capacities of OIC member Countries in Poverty Statistics 7-8th August Ankara, Turkey 9/24/2024 27
Initiatives to Combat Poverty Pakistan Poverty Alleviation Fund (PPAF) Zakat Fund Microfinance Punjab Government initiatives to eradicate poverty Tractor Subsidy Scheme. Sasti Roti Program Punjab Food Support Scheme Ramzan Sastay Bazar Subsidy of 8 million for Atta and Sugar Expert Group Meeting on Enhancing National Capacities of OIC member Countries in Poverty Statistics 7-8th August Ankara, Turkey 9/24/2024 28
Thank You Expert Group Meeting on Enhancing National Capacities of OIC member Countries in Poverty Statistics 7-8th August Ankara, Turkey 9/24/2024 29
