Position vs time graphs
Explore position vs. time graphs of objects at rest in this insightful guide. Understand how to interpret these graphs to analyze motion scenarios where the object remains stationary. Learn the key features and characteristics of graphs representing stationary objects to enhance your understanding of graphing motion in physics.

Download Presentation

Please find below an Image/Link to download the presentation.
The content on the website is provided AS IS for your information and personal use only. It may not be sold, licensed, or shared on other websites without obtaining consent from the author.If you encounter any issues during the download, it is possible that the publisher has removed the file from their server.
You are allowed to download the files provided on this website for personal or commercial use, subject to the condition that they are used lawfully. All files are the property of their respective owners.
The content on the website is provided AS IS for your information and personal use only. It may not be sold, licensed, or shared on other websites without obtaining consent from the author.
E N D
Presentation Transcript
Position vs time graphs Of an object at rest
Describe what the object is doing at 1 second, 2 seconds, 3 seconds, etc.? 5 m 4 m position At 1 seconds the object is located 4 meters from the origin 3 m 2 m 1 m 0 m 4 s 2 s 3 s 5 s 0 s 1 s time
Describe what the object is doing at 1 second, 2 seconds, 3 seconds etc.? 5 m 4 m position At 2 seconds the object is located 4 meters from the origin 3 m 2 m 1 m 0 m 4 s 2 s 3 s 5 s 0 s 1 s time
Describe what the object is doing at 1 second, 2 seconds, 3 seconds etc.? 5 m From 0 to 5 seconds the object is located 4 meters from the origin 4 m position 3 m 2 m 1 m 0 m 4 s 2 s 3 s 5 s 0 s 1 s time
If an object is staying in the same position for a time interval than its at rest. stopped. not moving. still. Represented by a horizontal line on a position vs time graph
Number your whiteboards from 1 to 3 and answer the question about the graphs Quiz tourself
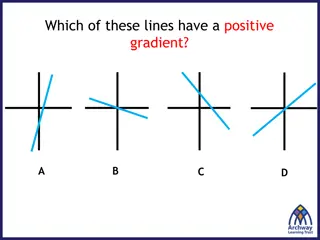
1) When and where is the object at rest? 10m 8 m position 6 m 4 m 2 m 0 m 4 s 2 s 3 s 5 s 0 s 1 s time
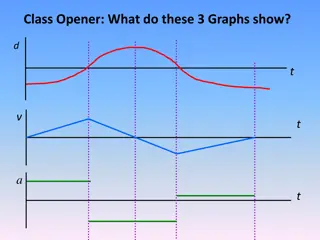
2) When and where is the object not moving? 5 m 4 m position 3 m 2 m 1 m 0 m 8 s 4 s 6 s 10 s 0 s 2 s time
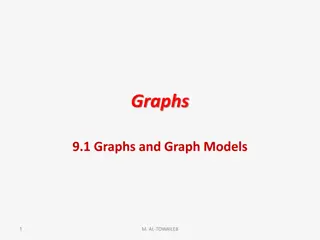
3) When and where is the object still? +3 m +2 m position +1 m 0m -1 m -2 m 20 s 10 s 15 s 25 s 0 s 5 s time
* Answers
1) When and where is the object at rest? 10 m From 2 to 4 seconds the object is located 6 meters from the origin 8 m position 6 m 4 m 2 m 0 m 4 s 2 s 3 s 5 s 0 s 1 s time
2) When and where is the object not moving? From 0 to 4 seconds the object is not moving at 4 meters away 5 m 4 m From 8 to 10 seconds the object is not moving at 3 meters away position 3 m 2 m 1 m 0 m 8 s 4 s 6 s 10 s 0 s 2 s time
3) When and where is the object still? +3 m From 15 to 25 seconds the object is located -1 meters from the origin +2 m position +1 m 0m -1 m -2 m 20 s 10 s 15 s 25 s 0 s 5 s time
* How did you do?
What would a position- vs- time graph look like of your desk as measured from the chalkboard -for the entire class period? How would your graph be similar, different from your classmates?


 When and where is the object")
 When and where is the object")
 When and where is the object")

 When and where is the object")
 When and where is the object")
 When and where is the object")