Performance Trends and Challenges in Modern Computing
Three key roadblocks hindering performance improvements in modern computing include power constraints, stagnant technology scaling, and limited innovation in complex ideas. The historical contributions to performance show that better processes, circuits, and organization have driven advancements, but future improvements will require more efficient utilization of multi-threading, data placement strategies, and the incorporation of accelerators. Hardware designers face challenges in enhancing single-thread performance, optimizing energy usage, facilitating data sharing, improving programmer productivity, managing memory systems, building accelerators, and ensuring security.
Download Presentation

Please find below an Image/Link to download the presentation.
The content on the website is provided AS IS for your information and personal use only. It may not be sold, licensed, or shared on other websites without obtaining consent from the author.If you encounter any issues during the download, it is possible that the publisher has removed the file from their server.
You are allowed to download the files provided on this website for personal or commercial use, subject to the condition that they are used lawfully. All files are the property of their respective owners.
The content on the website is provided AS IS for your information and personal use only. It may not be sold, licensed, or shared on other websites without obtaining consent from the author.
E N D
Presentation Transcript
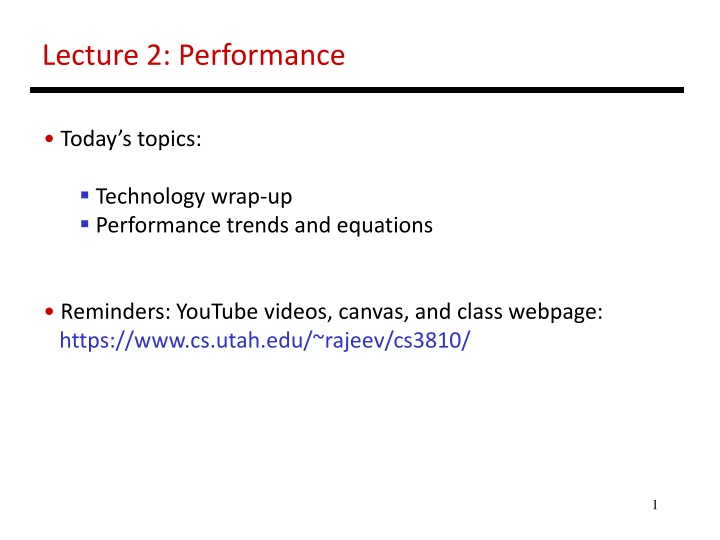
Lecture 2: Performance Today s topics: Technology wrap-up Performance trends and equations Reminders: YouTube videos, canvas, and class webpage: https://www.cs.utah.edu/~rajeev/cs3810/ 1
Summary Three roadblocks: power, ideas, technology scaling Fixed power budget because of cooling constraints; implies that frequency can t be increased; discourages complex ideas End of voltage (Dennard) scaling in early 2010s; the end of Moore s Law also imminent Has led to dark silicon and dim silicon (occasional turbo) The rise of accelerators 2
Important Trends Historical contributions to performance: 1. Better processes (faster devices) ~20% 2. Better circuits/pipelines ~15% 3. Better organization/architecture ~15% In the future, bullet-2 will help little and bullet-1 will eventually disappear! Pentium P-Pro P-II P-III P-4 Itanium Montecito Year 1993 95 97 99 2000 2002 2005 Transistors 3.1M 5.5M 7.5M 9.5M 42M 300M 1720M Clock Speed 60M 200M 300M 500M 1500M 800M 1800M Moore s Law in action At this point, adding transistors to a core yields little benefit 3
What Does This Mean to a Programmer? Today, one can expect only a 20% annual improvement; the improvement is even lower if the program is not multi-threaded A program needs many threads The threads need efficient synchronization and communication Data placement in the memory hierarchy is important Accelerators should be used when possible 4
Challenges for Hardware Designers Find efficient ways to improve single-thread performance and energy improve data sharing boost programmer productivity manage the memory system build accelerators for important kernels provide security 5
The HW/SW Interface a[i] = b[i] + c; Application software Compiler lw $15, 0($2) add $16, $15, $14 add $17, $15, $13 lw $18, 0($12) lw $19, 0($17) add $20, $18, $19 sw $20, 0($16) Systems software (OS, compiler) Assembler Hardware 000000101100000 110100000100010 6
Computer Components Input/output devices Secondary storage: non-volatile, slower, cheaper (HDD/SSD) Primary storage: volatile, faster, costlier (RAM) CPU/processor (datapath and control) 7
Wafers and Dies Source: H&P Textbook 8
Manufacturing Process Silicon wafers undergo many processing steps so that different parts of the wafer behave as insulators, conductors, and transistors (switches) Multiple metal layers on the silicon enable connections between transistors The wafer is chopped into many dies the size of the die determines yield and cost 9
Processor Technology Trends Shrinking of transistor sizes: 250nm (1997) 130nm (2002) 70nm (2008) 35nm (2014) 2019 transition to 10nm, now transitioning to 7nm Transistor density increases by 35% per year and die size increases by 10-20% per year functionality improvements! Transistor speed improves linearly with size (complex equation involving voltages, resistances, capacitances) Wire delays do not scale down at the same rate as transistor delays 10
Memory and I/O Technology Trends DRAM density increases by 40-60% per year, latency has reduced by 33% in 10 years (the memory wall!), bandwidth improves twice as fast as latency decreases Disk density improves by 100% every year, latency improvement similar to DRAM Networks: primary focus on bandwidth; 10Mb 100Mb in 10 years; 100Mb 1Gb in 5 years 11
Performance Metrics Possible measures: response time time elapsed between start and end of a program throughput amount of work done in a fixed time The two measures are usually linked A faster processor will improve both More processors will likely only improve throughput Some policies will improve throughput and worsen response time (or vice versa) What influences performance? 12
Execution Time Consider a system X executing a fixed workload W PerformanceX = 1 / Execution timeX Execution time = response time = wall clock time - Note that this includes time to execute the workload as well as time spent by the operating system co-ordinating various events The UNIX time command breaks up the wall clock time as user and system time 13
Speedup and Improvement System X executes a program in 10 seconds, system Y executes the same program in 15 seconds System X is 1.5 times faster than system Y The speedup of system X over system Y is 1.5 (the ratio) = perf X / perf Y = exectime Y / exectime X The performance improvement of X over Y is 1.5 -1 = 0.5 = 50% = (perf X perf Y) / perf Y = speedup - 1 The execution time reduction for system X, compared to Y is (15-10) / 15 = 33% The execution time increase for Y, compared to X is (15-10) / 10 = 50% 14
Performance Equation - I CPU execution time = CPU clock cycles x Clock cycle time Clock cycle time = 1 / Clock speed If a processor has a frequency of 3 GHz, the clock ticks 3 billion times in a second as we ll soon see, with each clock tick, one or more/less instructions may complete If a program runs for 10 seconds on a 3 GHz processor, how many clock cycles did it run for? If a program runs for 2 billion clock cycles on a 1.5 GHz processor, what is the execution time in seconds? 16
Performance Equation - II CPU clock cycles = number of instrs x avg clock cycles per instruction (CPI) Substituting in previous equation, Execution time = clock cycle time x number of instrs x avg CPI If a 2 GHz processor graduates an instruction every third cycle, how many instructions are there in a program that runs for 10 seconds? 17
